


In last week’s travel analytics insights, I showed you how COVID-19 changed our travel planning strategies. My plan this week was to continue the narrative using the same Skyscanner flight search data and present insights about conversion rates. However, something interesting caught my eye, and I decided to leave the topic of conversion rates for the next episode.
What happened?
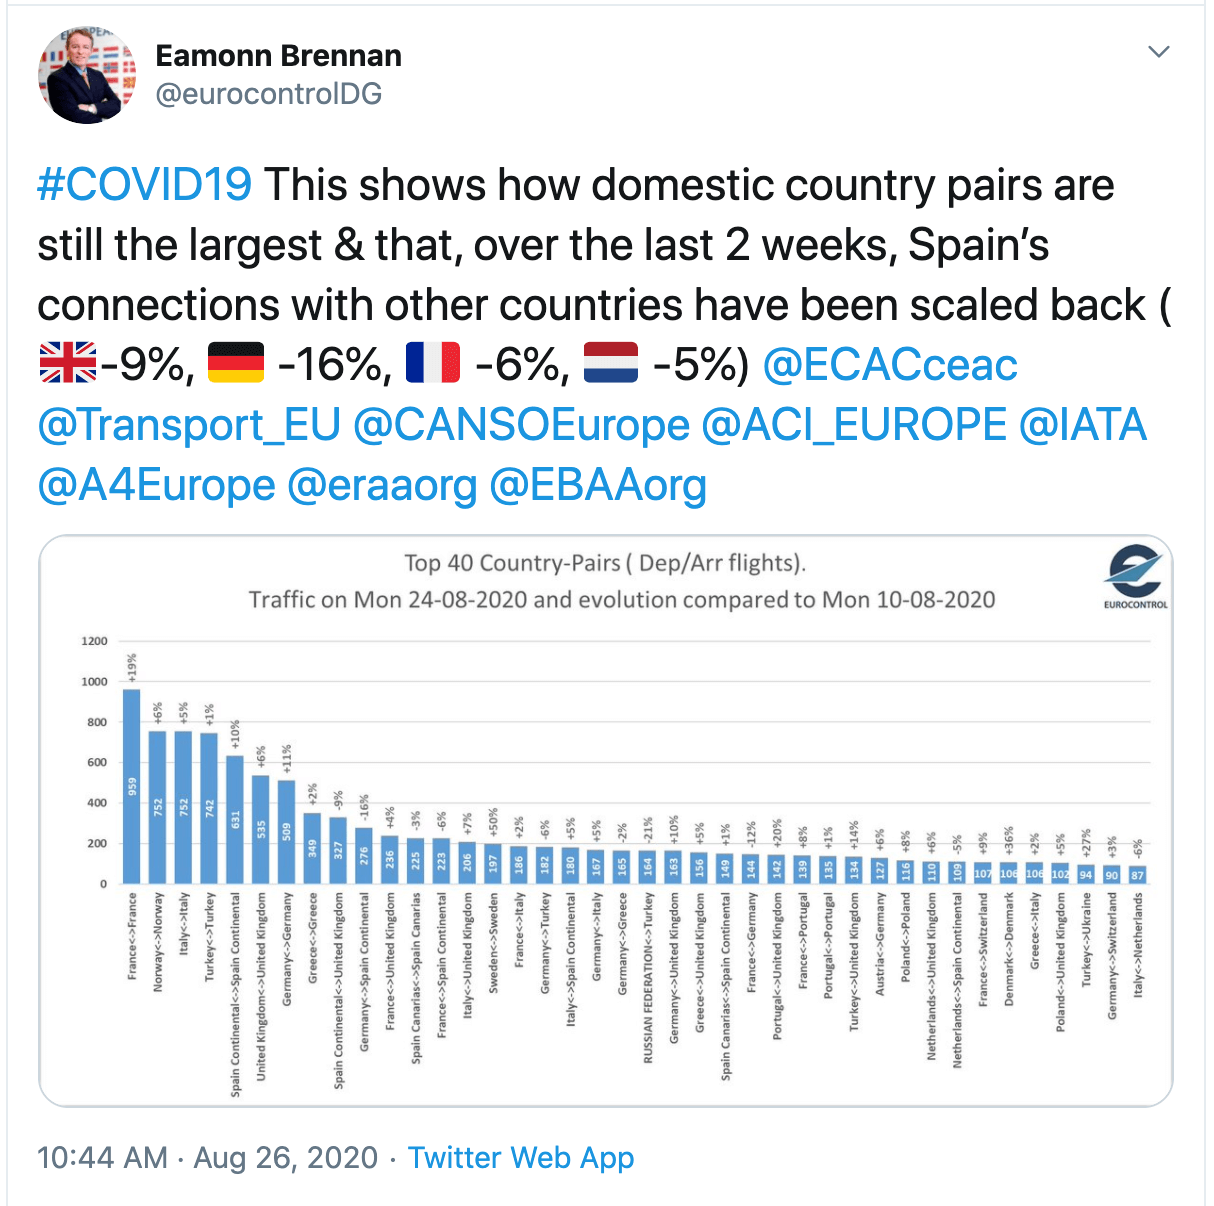
Source: Eamonn Brennan, EUROCONTROL
EUROCONTROL director Eamonn Brennan posted a chart on social media that shows the latest impact of COVID-19 on domestic and international flights.
This really intrigued me, so I decided to write a piece about this topic. I’ve been following Eamonn’s social posts for a while now, and they always present very interesting insights from actual flight data. Yet, I have seen that people sometimes grab the results too quickly and make conclusions that are not necessarily true.
That’s why I went back to Skyscanner’s flight search demand data to see if I could create a similar analysis by myself.
Read on and you will:
EUROCONTROL’s chart shows the number of country-pair flights on August 24 and evaluates the 2-week change.
We can see that the top 8 country-pairs are domestic. Furthermore, we see that the number of domestic flights predominantly increased (e.g.; +19% for flights within France) while the number of top international country-pair flights decreased (e.g., UK <-> Spain flights by 9%, or. Germany <-> Spain flights by 16%).
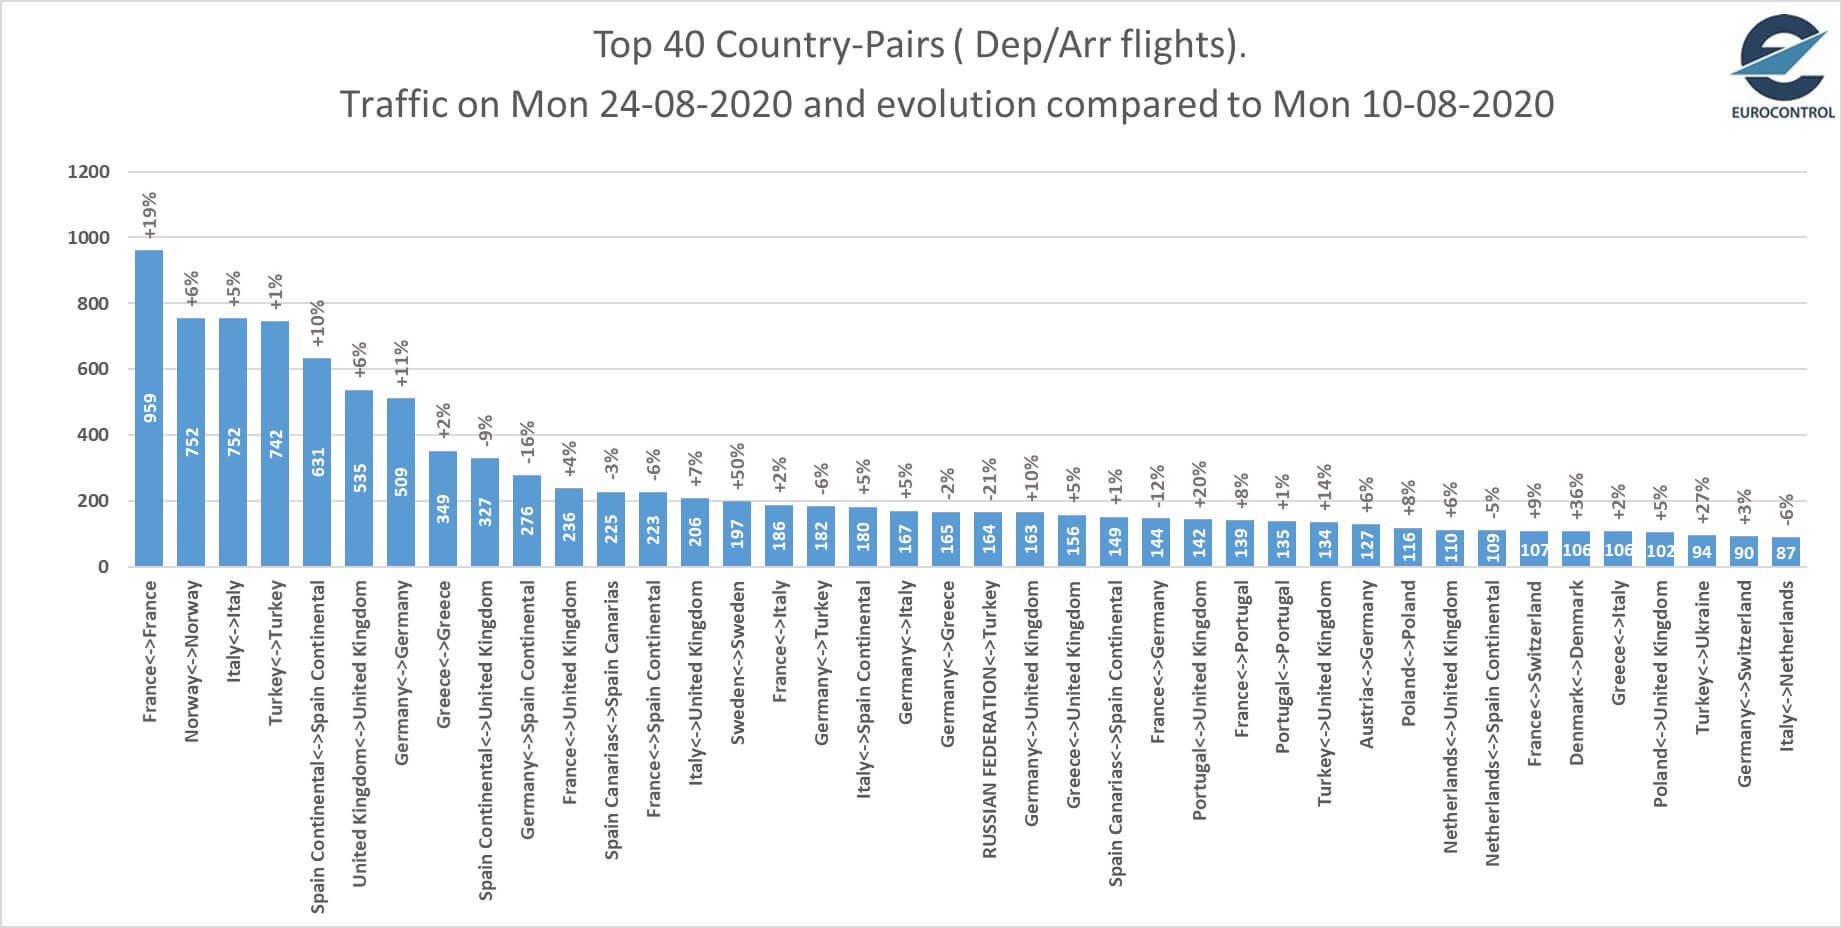
Top 40 country-pairs show that most planes flew on domestic routes on Aug 24. (Source: EUROCONTROL)
Cool insight, right?
Now, let’s try the same concept with the flight search demand data.
My goal was to mimic EUROCONTROL’s chart using data that I have access to. So, the chart below shows the 40 most searched country pairs on August 24 (compared to August 10).
Before we dive into the details, do notice some of the visual differences between EUROCONTROL’s chart and my chart:
These simple visualization improvements made the insights more visible and quicker to understand. You should be using these kind of visualization techniques in your analyses as well – they open up the story within the data so that important insights are not missed.
NOTE: We’ll cover analytics and visualization principles in detail in our Diggintravel Digital Retail Academy; if you want to take your analytics to the next level, make sure you check out the Academy curriculum.
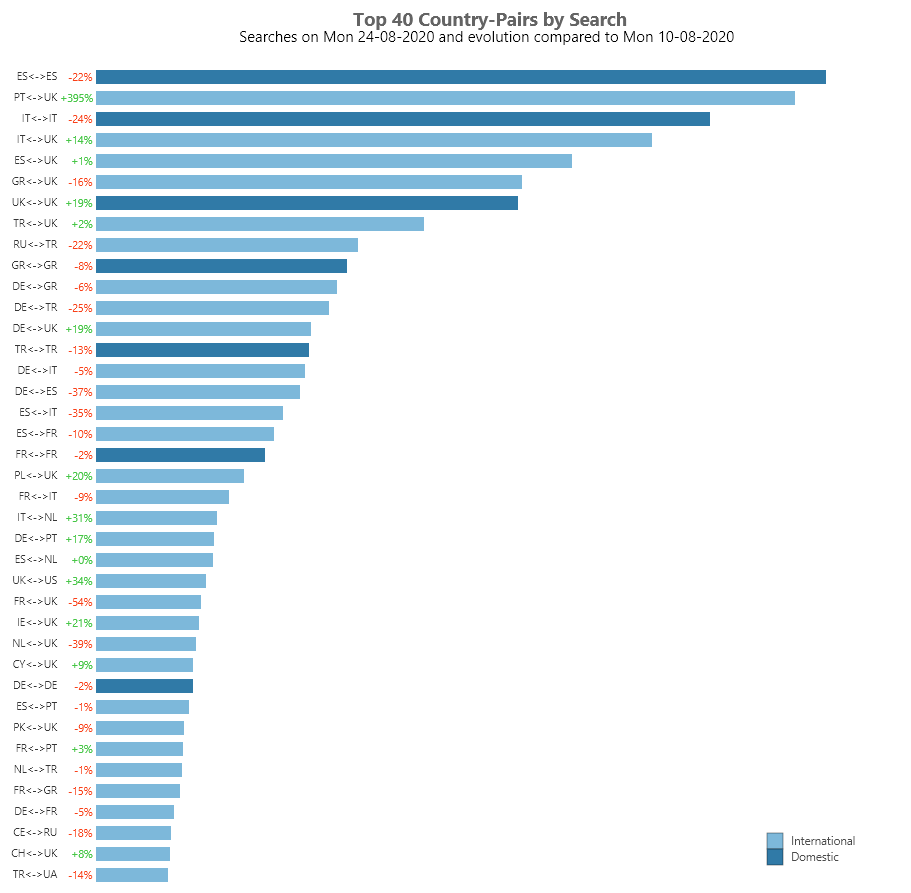
40 most popular country-pairs on August 24. Two of the most popular combinations are domestic, but they move in opposite directions.
A quick comparison of both charts clearly shows they are not telling the exact same story. We do see that two of the most-searched-for country pairs are indeed for domestic travel; however, interest in international travel is not as low as it seems when seen through the flight data lens.
There are a few reasons that explain this difference. For example:
There might be another reason for the differences here: potential data bias!
Although biases have lately been mostly discussed in the context of artificial intelligence and machine learning they are a big issue in descriptive analytics as well – check out this article to learn more.
Bias is anything that causes the data to show patterns, correlations or simple insights that aren’t really there.
I’m not claiming that the EUROCONTROL data is biased, but there are some indications that are warning us to be careful in our interpretations.
This potential bias is also not systematic or intentional and is only problematic for some types of conclusions. For example, when we use this data to make a conclusion about whether people mostly travel within their own country or abroad, it exhibits the so-called measurement bias (i.e. not representing the real-world environment).
Let me explain… EUROCONTROL is tracking flights by various types and sizes of aircraft. Now imagine that smaller planes are more frequently used on short domestic flights and they carry only a few passengers. It this is true, then big reasons for the suggested change in travel habits is most probably due to the following reasons as well:
Biases of all kinds are stored in our data and it is up to us, the airline professionals, to recognize and understand them.
If you want to learn more about biases and other analytical concepts, check out Module 3 of the Diggintravel Digital Retailing Academy.
Okay, comparing two dates was nice, but what about the long term trends?
Is the share of searches for domestic flights increasing or decreasing?
The chart below shows the trend across all countries. It tells us that since the beginning of May, interest in domestic flights has increased a bit (to around 25% in August compared to around 20% in May).
However, it also tells us that this trend seems to have plateaued.
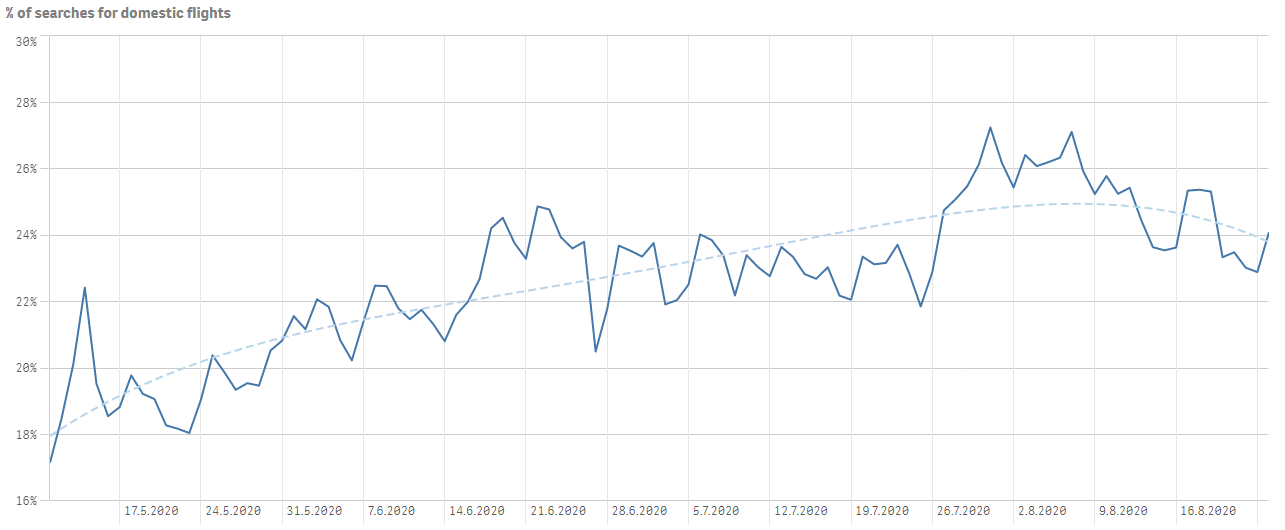
The demand for flying to domestic destinations has been steadily rising since the beginning of May.
And yet again, we must not forget that this trend is an average and that specific segments (e.g., countries) may exhibit a different temporal patterns.
Look at the chart below – it shows the trend for the UK with Ireland, Spain, Italy, and France.
Notice how although the trend for all countries is generally pointing upwards, it is not shaped the same way or positioned at the same level.
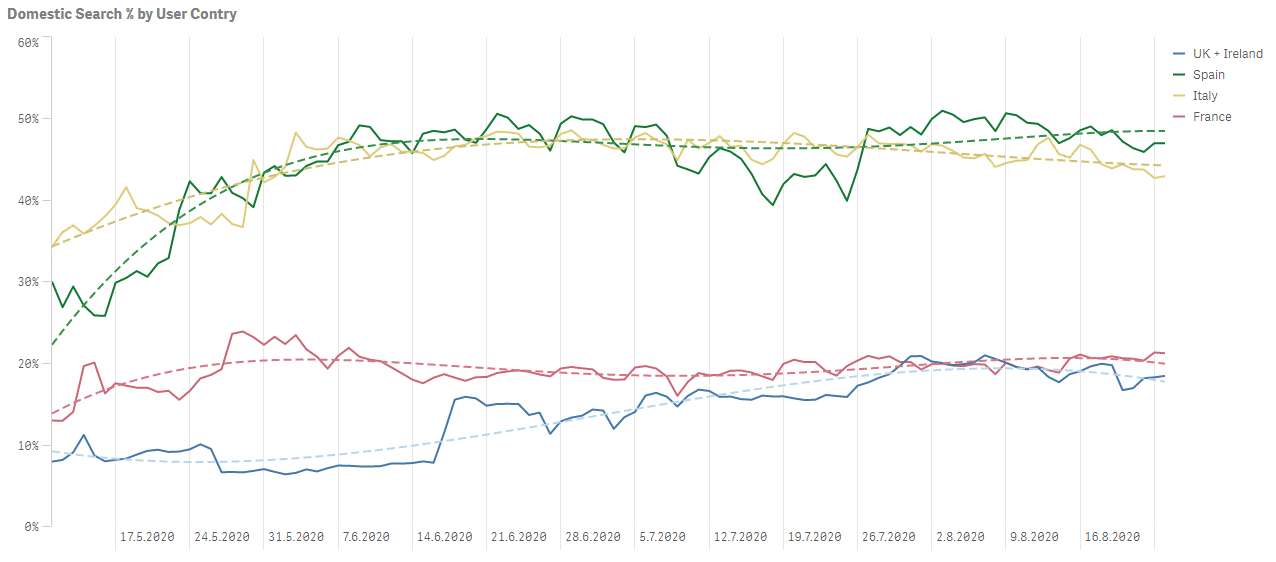
The COVID-19 trend of demand for domestic flights in the UK with Ireland, Spain, Italy, and France is not the uniform
Based on these simple analyses, I cannot yet be sure that COVID-19 indeed significantly shifted the flight demand towards domestic destinations.
However, it is clear that the trend is pointing in this direction, especially within certain segments. The next step for sure is a more thorough analysis, including testing of more hypotheses and analyzing additional data sources.
However, for today I hope I achieved my goal. I hope I showed you interesting data, raised a few more questions, and generated enough insights to fuel further investigation.
And that is what agile travel analytics is all about!


No Comments