

COVID-19 has turned most of the things we do in the travel and airline industry upside down. Most of the processes you’ve been doing for the past ten or even twenty years are all of a sudden not relevant anymore. One of the areas where this is definitely true is how you do travel analytics and analyzing air demand.
What should a new method of demand analysis look like? How should you do agile travel analytics? Will the airline distribution landscape change in the future?
We talked about all of this in our recent podcast with Gavin Harris, a travel industry expert and Commercial Director at Skyscanner.
But there’s more!
You know we always want to be as hands-on and practical as possible at Diggintravel. So, you can see Skyscanner’s demand data in action and find examples of real airline reports and agile travel analytics dashboards in the second part of this article.
Listen to the new episode of the Diggintravel Podcast via the audio player below, or read on for key highlights from our talk with Gavin and examples of real travel demand dashboards.
And don’t forget to subscribe to the Diggintravel Podcast in your preferred podcast app to stay on top of the airline digital and travel analytics trends!
Let’s first clear up one thing; you should have been doing agile travel analytics long before COVID-19 happened. A while ago, we did a detailed article on how agile analytics differs from traditional analytics principles. So, this is not really new.
What is new is that COVID-19 has made all of your historical travel data almost irrelevant. When you do your planning now, your historical booking and other data is not really helpful. Even more, the situation is changing on a weekly basis, depending on the virus situation, government and border restrictions and other events.
Here is how Gavin Harris from Skyscanner described this change in planning and demand cycles in our recent podcast chat:
Things have changed dramatically. For an industry that looked at seasonality and could look at last year and make most decisions based on that, we’re certainly in changed times moving forward.
We’ve started to see new trends. In the early days [of COVID-19], when the U.S. market started to realize that there would be restrictions coming into place, there was a significant shift in terms of users searching for short haul, one-way flights [with] booking windows within 7 days. You can see a spike in that level of traffic and a shift away from international traffic and long haul, return flights.
So the search data and the user behaviors is absolutely paramount for airlines.
In the airline industry we used to plan in yearly cycles (for example, summer and winter seasons) and relied heavily on historical booking and seasonal data.
Now, things are changing almost on a weekly basis!
Skyscanner is also tracking passenger sentiment. They survey more than 7,000 travelers each week, and Gavin talked about how they see sentiment changing very quickly and its effect on search demand data based on the COVID-19 situation:
Within I’d say under 7 days, we have data and we can see [traveler] sentiment, shifting on a week to week basis, and [it’s impact on] search data that we get from our Travel Insights product.
When we started to see green shoots coming from European markets – Germany started to say they were going to open up their borders, France then followed, Spain removed the 14-day quarantine – that immediately translates to search and referral traffic on our site. [They are] encouraging signs in terms of an improvement in our year on year traffic.
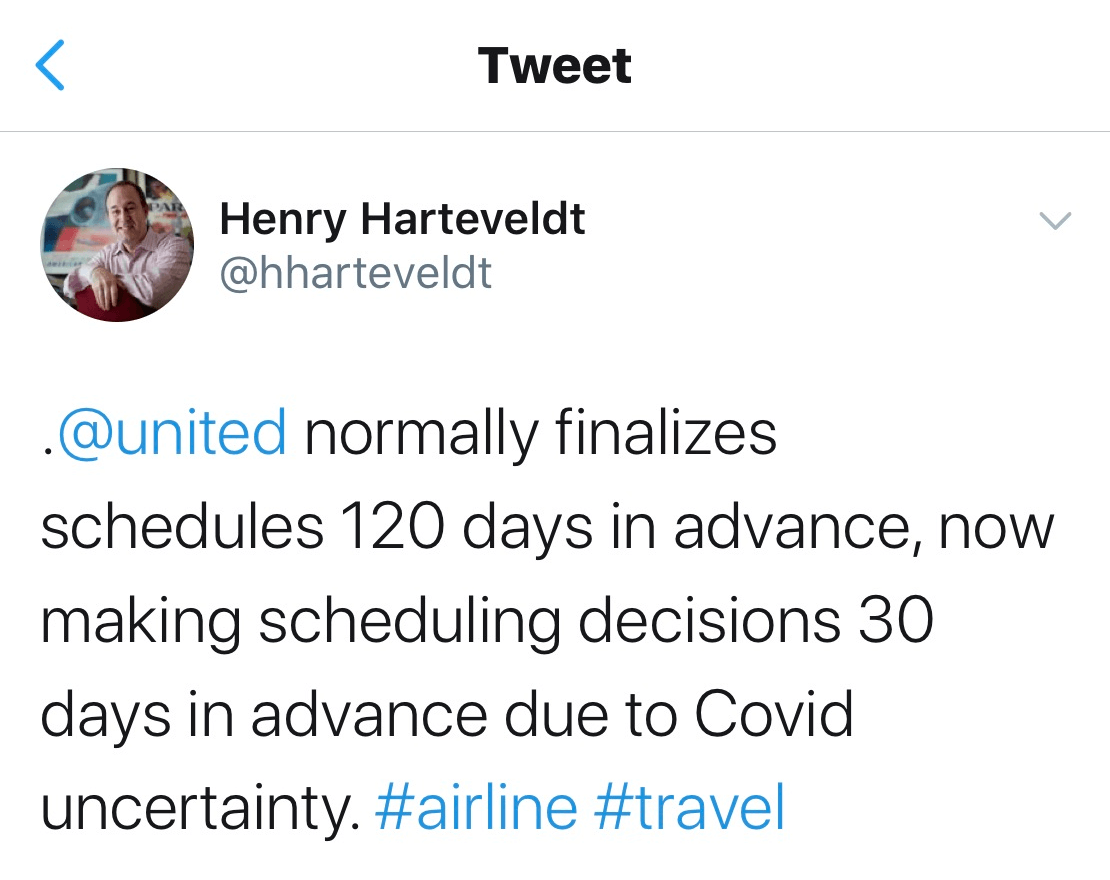
We’ve already seen airlines adapting to this new environment and faster planning cycles. Here is a tweet from my colleague and travel industry analyst Henry Harteveldt on how United Airlines has sped up their schedule planning:
What does this mean for airlines and your travel analytics?
Going to shorter, almost weekly planning cycles and being able to proactively analyze data and identify trends is just the first challenge. The second challenge is to find and process external demand data sources that will allow you to find the new trends. Before COVID-19 you could rely heavily on your internal data (e.g., your own website search data, current and past booking data, etc.) for a lot of analysis and planning.
Now, looking at internal data is not enough for your travel analytics. You need to find external data to help you understand demand trends. Here is Gavin again talking about this challenge:
Airlines might have their own data sources in terms of what their own travelers are doing, who’s searching on Airline A’s website and some of the behaviors, but they don’t necessarily have the bigger picture.
They don’t have a global customer base across multiple markets. They have a specific segment of users they’re looking at that are maybe LCC customers rather than full-service carrier customers. We’ve been able to help in that, giving [airlines] a bigger picture and really enabling them to see those green shoots of recovery, even down to a route by route basis, to allow them to have the extra confidence to start putting capacity back in the air.
Skyscanner’s search demand data is one external source airlines can use to understand demand trends. But even Skyscanner themselves know that only one source and one type of data is not enough. They understand that to interpret the data, to understand the context, they need more. One way of adding context to their search demand data was the aforementioned sentiment analysis. But they didn’t stop there; they added other sources of external data to their travel analytics:
We started to look at all the sources of data that we had and started to map them together for internal use. This came from [our] travel demand data, so the search activity and referral activity that we’ve got on our website [and] we also started to incorporate other sources of data, like capacity data from OAG, Google Trends data, even down to COVID case and infection rate data from Johns Hopkins.
We married that with [sentiment data] a weekly pulse survey with about 7,000 of our regular travelers, asking them questions like, ‘Do you think that the COVID situation is becoming better or is it getting worse?’, ‘When will you be prepared to fly again? Is it in 7 days, is it in a month, is it 6 months, etc.?’ That sentiment piece has been extremely important because there’s one thing of governments and countries removing border restrictions, but then there’s the traveler actually having the confidence and ability to go ahead and book the travel, book an airline ticket, book a hotel, etc. So the sentiment piece has been hugely important.
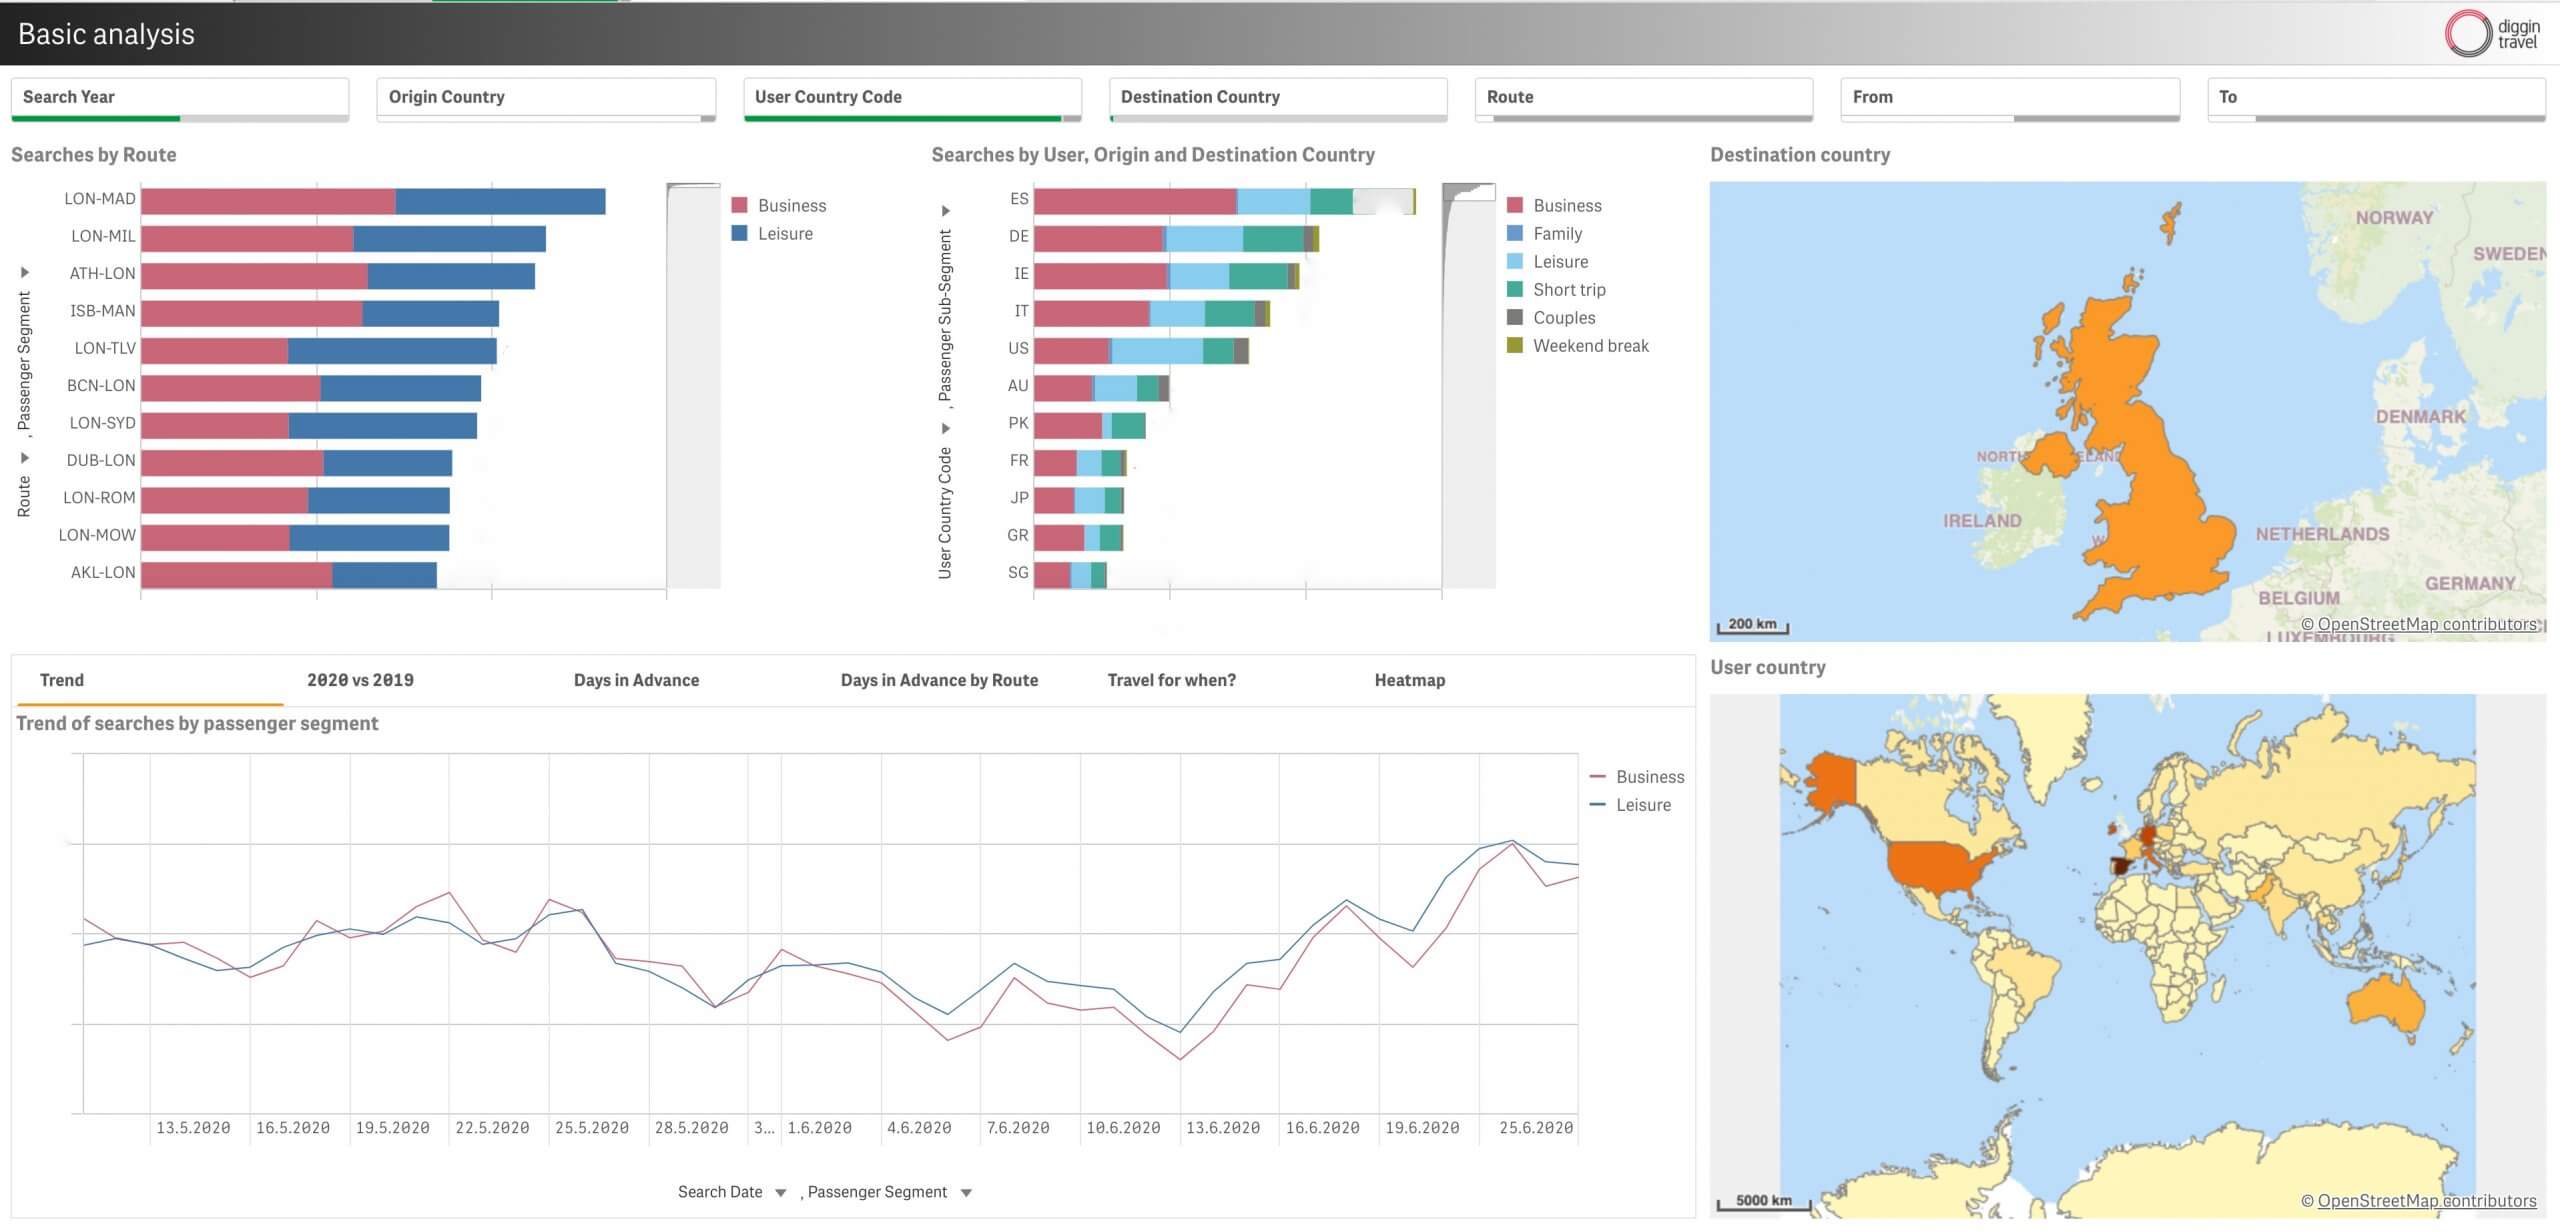
As promised to you in the intro, we tried to discover how we can do agile travel analytics in practice. For this experiment, we used Skyscanner’s search data and looked for some of the patterns we talked about with Gavin in the data.
As you can see from the three examples below, the correlation between events (opening of borders, quarantine, etc.) and demand trends is evident and happens very fast.
The first example I wanted to check was travel bubbles. In May, before countries opened their borders, some countries opened the borders for neighboring countries with similar virus situations. Here is an example from Scandinavia, where Norway and Denmark opened borders for each other’s citizens, but not for citizens of Sweden, where the COVID-19 situation was worse. The top route connecting both capitals (Copenhagen and Oslo) saw an immediate peak right after the restrictions for travel were communicated on May 28th:

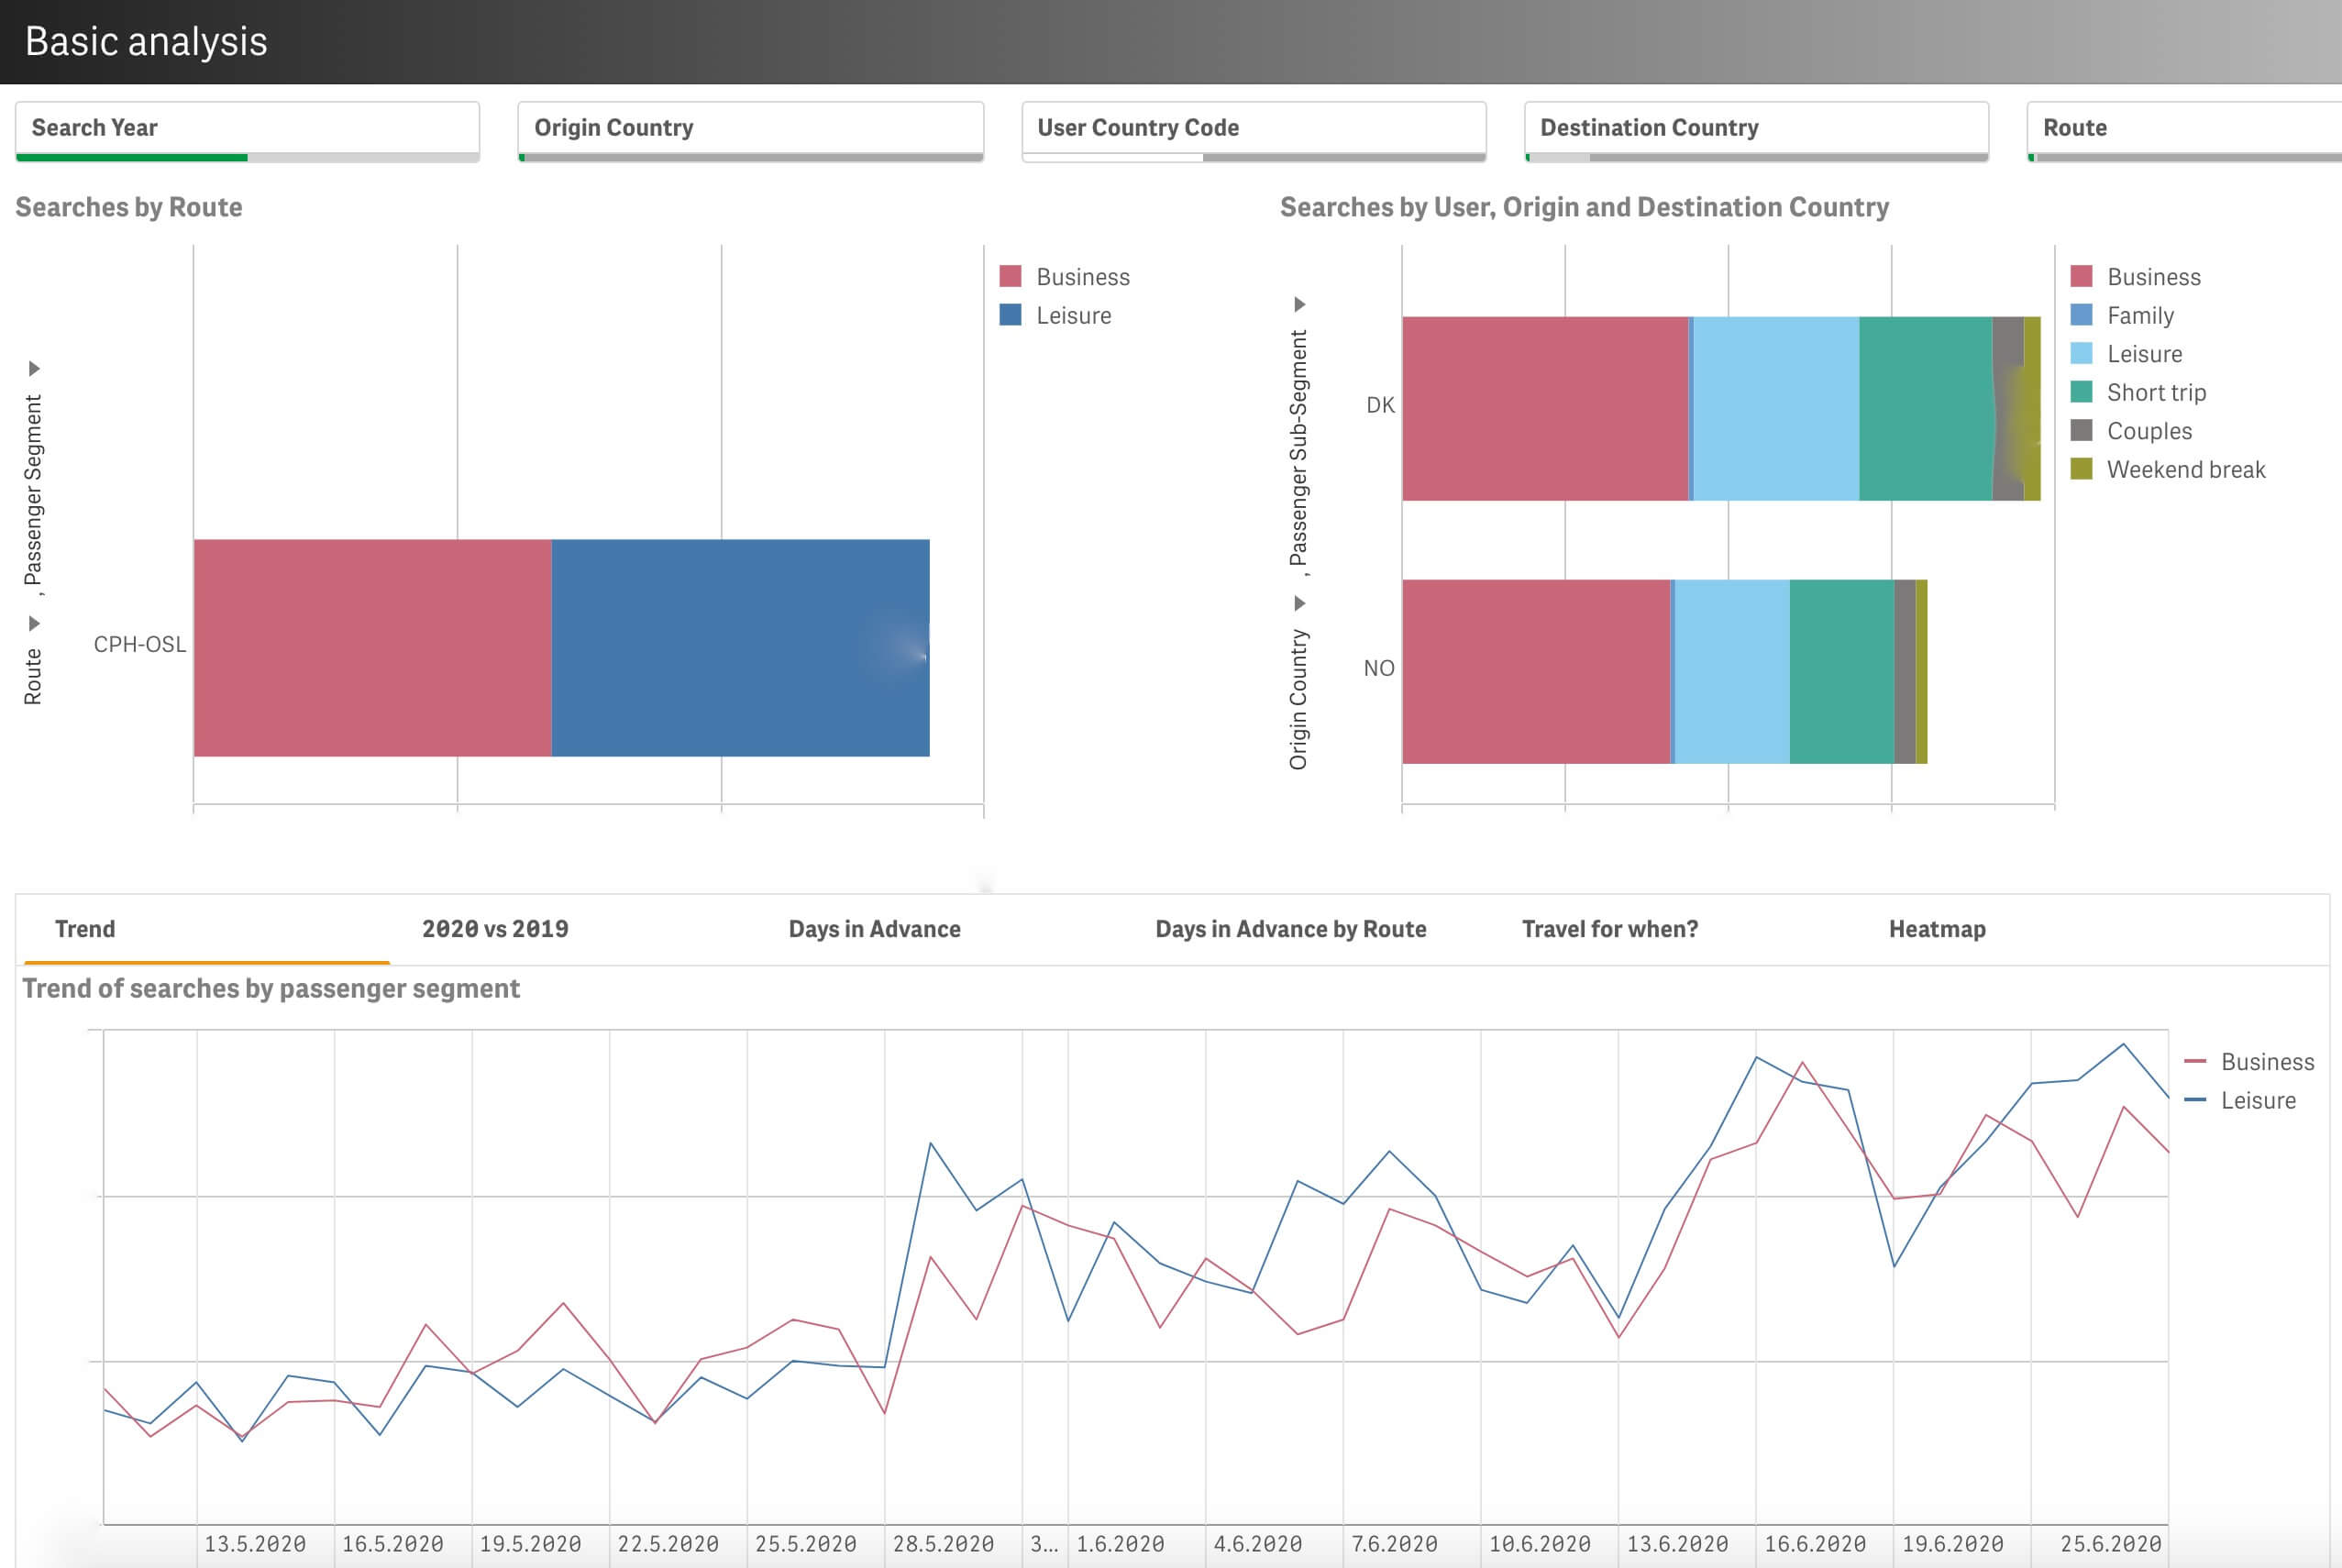
We built some basic segments on top of the data to see if the air demand trends differ. In this case, we see similar demand trends for both business and leisure segments.
Spain, like many other European countries, opened its borders for most EU countries in June. In this case, again, we can see that it didn’t take long for demand to spike around the opening date, June 21st. Germany is one of the biggest source markets for Spanish tourism, especially the Balearic Islands. Here you can see how demand peaked once the border restrictions were lifted:

You can see air demand for leisure segments is much higher in this case.
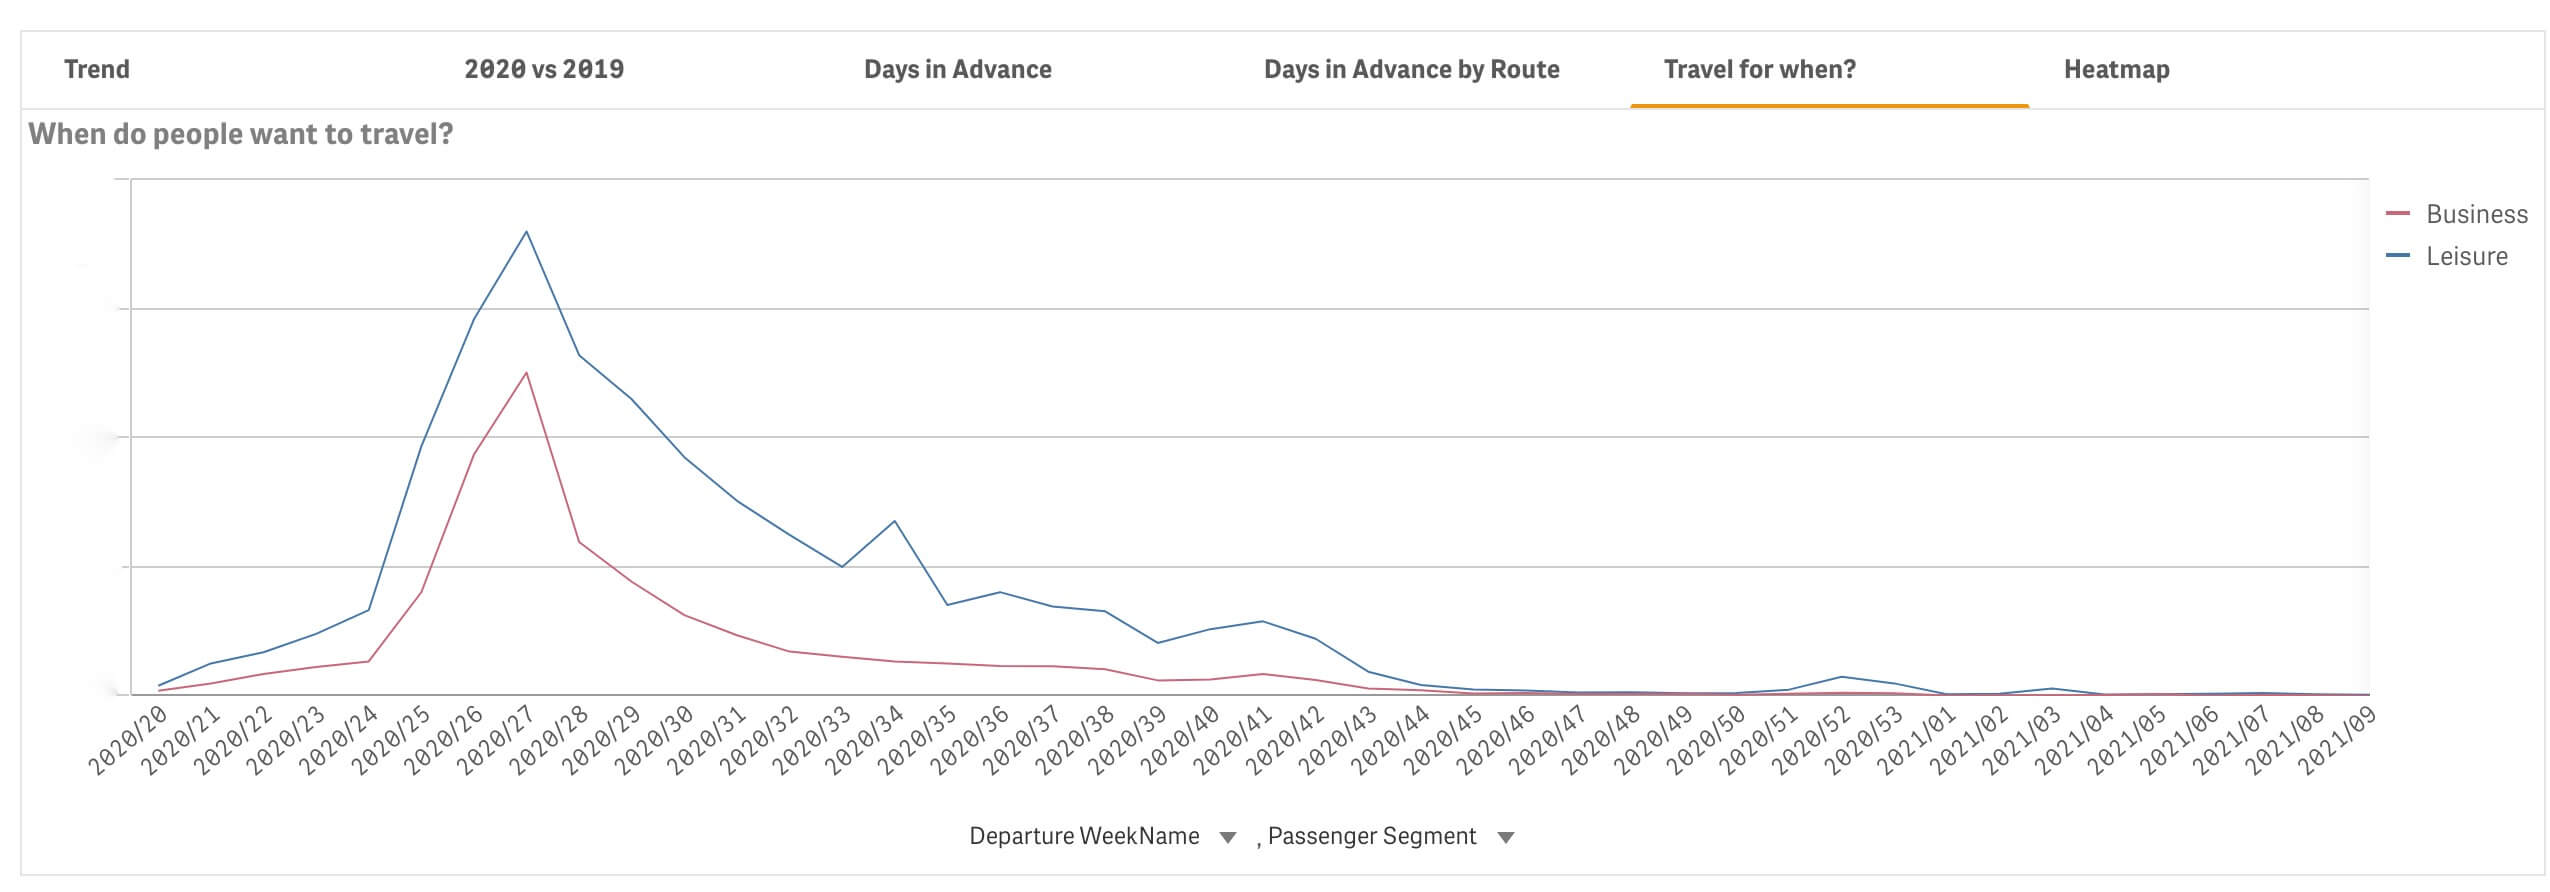
Britain has had its own struggles when it comes to handling the COVID-19 situation. The government decision to impose a quarantine just as air travel was picking up has enraged airlines and many travelers. The government introduced a plan requiring everyone entering the country to self-isolate for 14 days. Below, you can see the search demand trends for UK based routes for non-UK based users.
Quarantine effect on the demand for travel to UK SOURCE: Diggintravel Data services
Search and air travel demand for people traveling to UK destinations didn’t increase as much because of the quarantine restrictions. While you could see a strong
increase for the leisure segment on the Spain inbound example, for the UK the demand is almost evenly split between business and leisure.
Spain is the biggest inbound segment for UK searches, and you can see how “UK quarantine” search queries peaked in Spain after this measure was introduced in June:
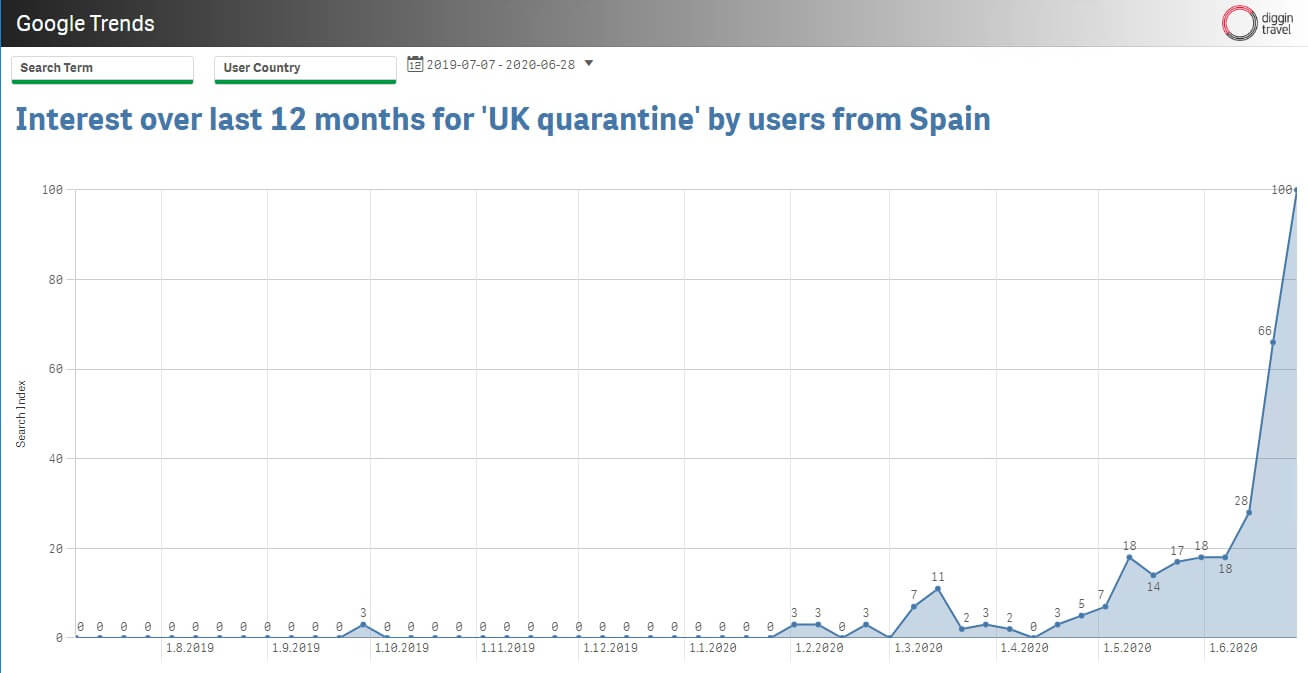
UK quarantine search queries trend in Spain SOURCE: Diggintravel Data services
We mostly used Skyscanner search and Google Trends data for our examples; however, that was not the main point of our exercise. What we wanted to show you is that you need agile travel analytics to be faster and more proactive in your planning. If you want to adapt to the new, faster paced and more volatile environment, you’ll need to have agile travel analytics capabilities.
We know that for most airlines, analytics and data capabilities are limited currently. Here is how we can help you:
If you want to learn more, check our DATA SERVICES page, or even better, CONTACT US to see some live demos of agile travel analytics in action!
[NEW] – Check out our Airline Digital Academy training – The only training designed especially for the airline digital professionals that includes a special model for agile travel analytics.

No Comments