


You open your Google Analytics to check the bookings. The conversion rate is down for another week. Now panic kicks in.
You’re scratching your head asking yourself what the hell is happening. Where are you losing bookings?
We’ve all been in this position at some point, right?
If you are a travel ecommerce professional, understanding your travel booking funnel is probably your most important task.
But to understand what’s happening with your travel website’s conversion rate, you first need to measure it properly.
And no, just measuring your overall conversion rate is not enough. For real conversion rate optimization knowing that your website is leaking money is not good enough.
You need to know WHERE. And you need to know how to fix it.
You can read this article in two ways depending on your needs and skills:
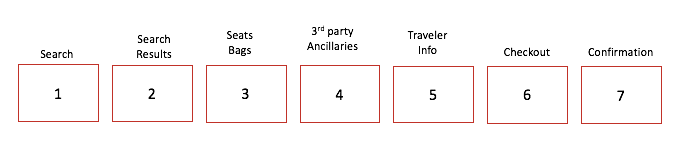
Your online travel booking funnel is most probably still a linear, step-by-step process. First, your users do a search via search form then check the results on the search results page. This is where most of the drop-off happens.
The next step is usually the ancillary (add-on product) upsell & cross-sell page (s), followed by the traveler info page. The last two pages in the funnel are the payment page and confirmation page.
Basically, you want your users to go through the steps in the booking process with as little friction as possible. And buy as many ancillary products along the way as possible. 🙂
An example of a travel booking funnel – Airlines
Generally, you do conversion rate optimization (CRO) for your travel booking funnel the same way as for any ecommerce online store. All main CRO principles apply; however, there are some important differences you need to keep in mind:
By now you’re probably thinking, I get the overview and stats but show me how can I actually see where losing money. So, let’s deep-dive into the actual analysis and reports.
First, we’ll show you how you measure your travel booking funnel from beginning to end.
Then we’ll follow up with additional reports that will help you understand what’s happening at each of the most important steps in your funnel.
If you want to increase the conversion rate for your travel website, you need to measure it properly. You need to break down your travel booking funnel into steps and map those steps in your analytics.

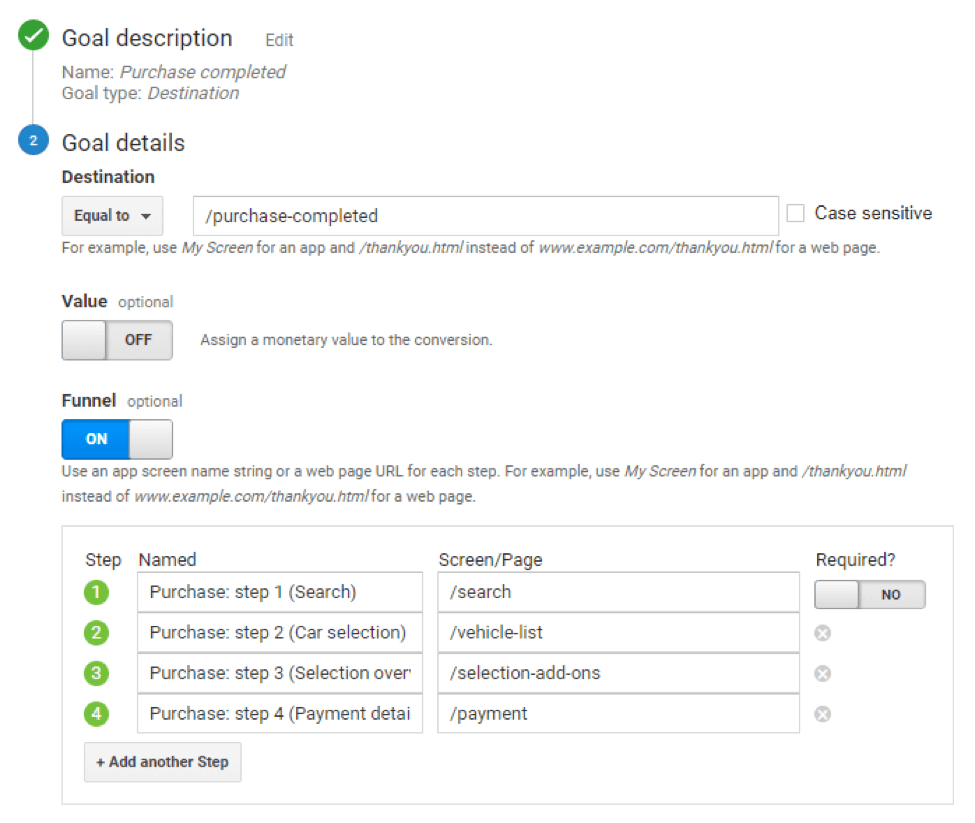
The first thing to do is to map out steps on your website and use the same steps for setting up goals in your Google Analytics. We’re used to setting up a single goal with a funnel that contains all steps, right? And we’re going to set this up as well (check out the next report). But first, we’re going to set up separate goals for every funnel step. Right now you’re probably thinking, “why,” but please bear with me. 😉
I’ll show you the process for a car rental booking website, however same logic applies for an airline or a hotel booking path.
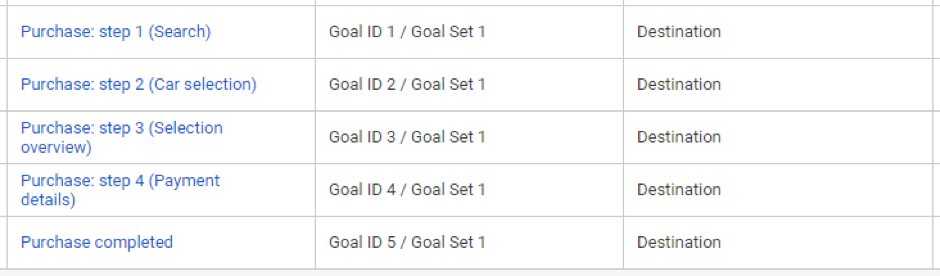
You need to create Goal 1 for every search made, Goal 2 for every car viewed (search results page), Goal 3 for every Add-on step the user saw, Goal 4 for every step with payment details, and Goal 5 for completed purchase.
That way you’re going to track every user and will be able to see how far into the funnel each user went. While setting up goals using Destination type, check that the URLs that you are using match the URLs in Site content > All Pages report. Your goal list should look something similar to this:
After you set up goals above (and have been collecting data for some time, DUH 🙂 ) you can start analyzing the data.
If you look closely, you’ll see that all goals are inside Goal Set 1. The reason for this setup is that we can now use default reports in Google Analytics to analyze data. All we have to do is use “Goal Set 1” view instead of “Summary” view in Explorer.
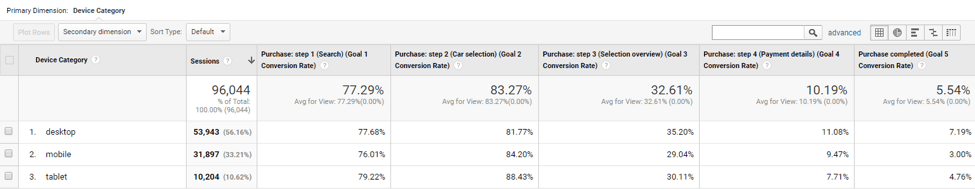
But now you can also do something else: Take default report and pimp it up into any kind of custom report with dimensions that we like to get insights about, i.e., Device categories (Desktop, Mobile, Tablet), User types (New users, Returning users), etc.
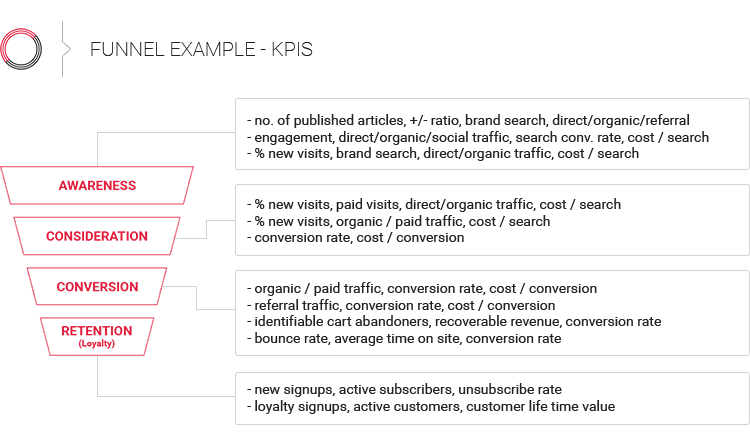
Below is an example of a report with device categories, which shows you at least one interesting thing: If you compare Goal 5 (Purchase) conversion rate amongst devices, it is higher on desktop than on mobile devices. But on the other hand, the 2nd step’s (Cars list) conversion rate is higher on mobile than desktop devices. In addition, you can see the biggest drop-off on Mobile occurs at the last step.
Now, let me get back to the single goal with a funnel which contains all steps. Of course, this goal is a must, and you should create it. Why?
The main benefit of this kind of set up is that it will enable you to visualize steps, measure transition rates amongst them, and measure drop-off levels of each step. Unfortunately, Google Analytics doesn’t allow the use of these segments inside visualization reports, but you can work around it if you use the Enhanced ecommerce feature.
Below I’m using the same example as before, but I’m just putting all of the steps into one goal:
Here are a few things that you need to be careful about:
The Visualization report that was set up, as shown above, should look similar to the one below:
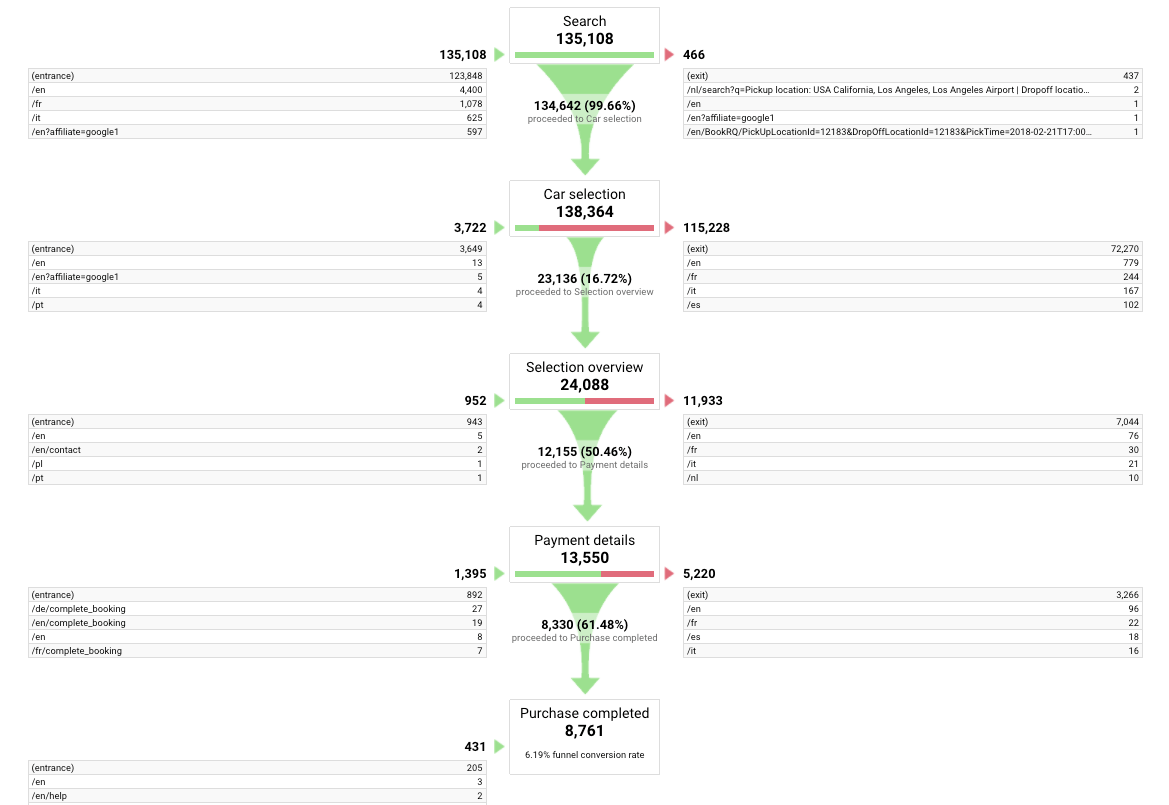
One thing you’ll notice is that users enter and leave the funnel at different steps. There’s nothing wrong with this, and it’s totally natural. But you can see this in this report because in goal settings we didn’t set the first step as required. If we’d have done so, then the report would have taken it into account and shown the flow just for the users that entered the funnel at the beginning—at the first step.
Creating a report that shows you a step-by-step breakdown of your booking funnel should be your first step. Once you have that overview, you need to see what’s happening at each step. And the first step in your booking funnel is the search.
To understand what your users are searching for you need to store this data. More important, you can use search data to get important insights later with data analysis.
There are two nonexclusive ways to store your search form data in Google Analytics:
Storing values in event labels gives you the freedom to format data as you like. Besides category and action, event label is one of three dimensions that you can use to put an event into context. In practice, we use label dimension to give us more detailed data about the event.
Since event label is a text type dimension, it has a limit of 2048 bytes (which is usually more than enough). My advice: Use event labels as a string with “key: value” pairs and delimiter. This way you can use labels later—parsing it and analyzing multiple parameters. Example of event label value: “Pickup location: Argentina, Salta, Salta Downtown | Dropoff location: Argentina, Mendoza, Mendoza Airport | Search timestamp: 2017-12-28 18:16:09 | Pickup timestamp: 2018-08-10 12:30:00 | Dropoff timestamp: 2018-08-15 12:00:00 | Country: fr | Driver age: 31.”
Storing values in custom dimensions will enable you to use more exhaustive custom reports in Google Analytics instead of default ones. This way we can get some additional insights about our users. The only downside of using custom dimensions—unfortunately, this is a really big one—is that Google Analytics is limiting the number of available custom dimension slots to 20 per property. This means that we can use just 20 different custom dimensions in all views under the same property. If you’re eager to get more data to get more insights, then 20 quickly becomes too little … that is, unless you can afford Google Analytics 360 Suite. 😉
Here’s the example list of newly created custom dimensions that correspond to event label in the example above:
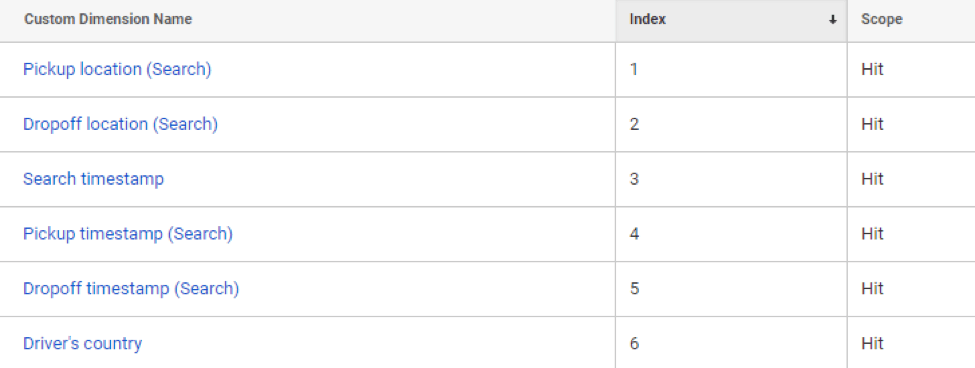
Note that we now have 7 different custom dimensions, but they’re actually the same as in the event label example.
Custom dimensions are most commonly used in custom reports. Here’s the example of a custom report with custom dimension “Pickup location (Search)” from above:
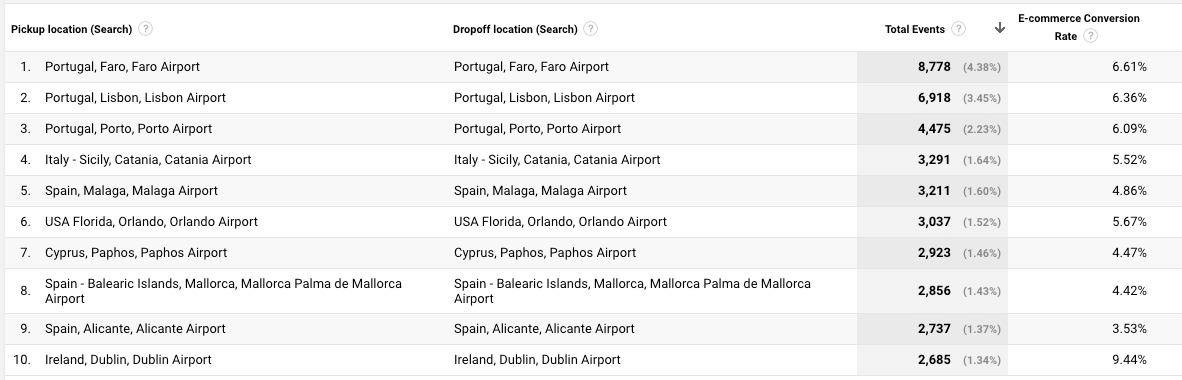
You can see that we can use custom dimensions in exactly the same way as default dimensions. By combining different dimensions, we can get additional insights about users.
Search results page is when you display the results to your users after they complete the Search form data. It’s also a step where most of your users will abandon your travel booking funnel. So, I probably don’t need to explain why it is crucial to analyze it in more detail.
Tracking search results page can be quite complex. Again, I can recommend two nonexclusive ways to set it up:
Integrating the EEC plugin and sending search results as product lists shouldn’t be too difficult. You just have to follow Google’s instructions exactly (check example at https://developers.google.com/analytics/devguides/collection/analyticsjs/enhanced-ecommerce#product-impression).
After you set it up, you’ll be able to see some interesting default reports. Below is one of the custom reports that combine a few dimensions and metrics from different default reports:
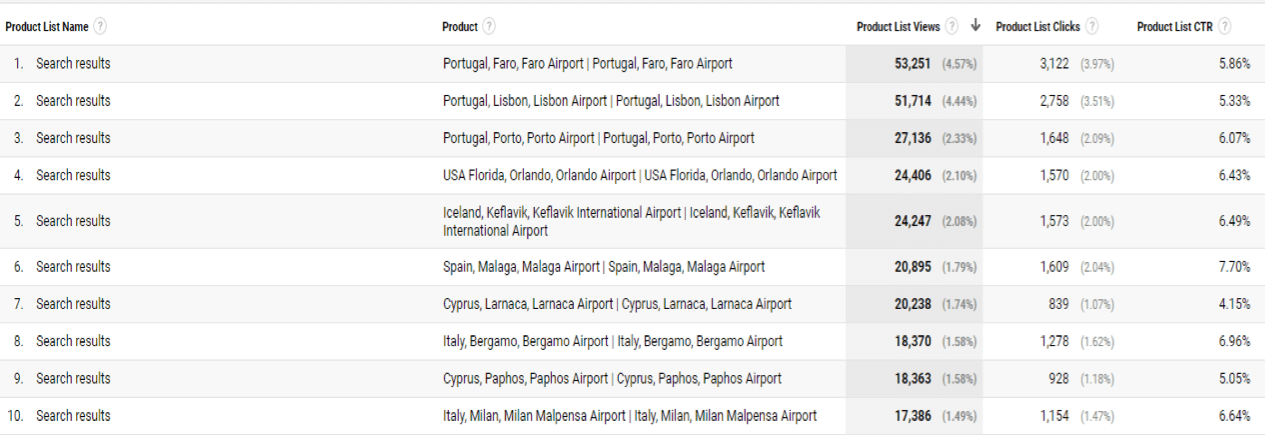
The report above is an example of how you can track which products were shown as search results. In addition, you can see how many times they were viewed and clicked.
We can achieve the same goal by using our own custom JavaScript code. The reason to use it could actually be just one—that we don’t use the EEC plugin.
One other thing you can achieve with a custom JavaScript code is actually getting some info about user experience. We can set up a report in which you don’t care about actual products but—you would just like to know how engaged your users are.
We do this by measuring how many products users saw or scrolled down to (average number of products or average percentage of products shown/scrolled down to) and maybe even track additional product clicks. It’s very similar to read rate tracking. An example of a report is shown below:
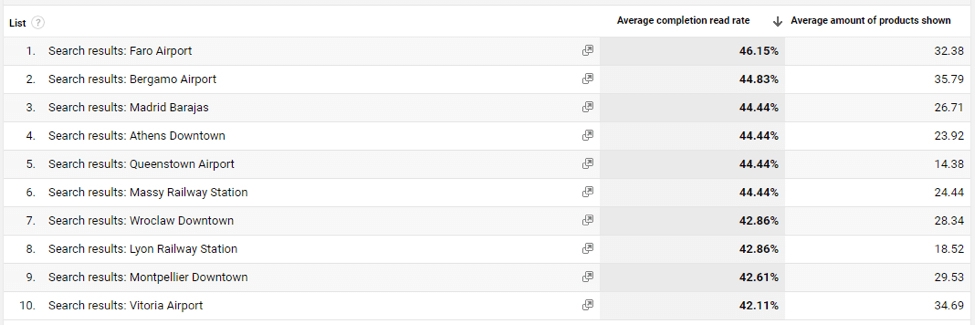
You can check how often search results lists that were initiated with different search phrases were read to the end (all products were shown) and how many products users saw on average.
Showing and selling your core travel products (flight, hotel room, car, etc.) should be your main goal; however, your analysis and reports should not stop there.
Generating ancillary revenue by upselling add-on products and cross-selling 3rd-party products is becoming a critical part of every travel ecommerce business. This is why you need to have detailed analytics in place to understand how effective you are at this process.
From a technical point of view, add-ons are simply additional products. Therefore the implementation of their tracking is quite simple. The first thing you should do is set up a custom dimension, i.e., “Product type,” that will tell us if a product is of normal type or if it is an add-on.
Next thing you need to do is to include add-on products in ecommerce data that you’re sending from our website (i.e., when a user makes a purchase, then the data about the purchase of the main product and all add-ons are sent to Google Analytics). This way you’ll have all conventional data in Google Analytics, and you’ll also be able to do additional analysis by using “Product type” dimension.
In addition, you can use other custom metrics to send profit data into Google Analytics. By doing this, you can compare revenue and profit of different product types (main vs. add-on).
A bit more advanced is tracking of post-purchases, which in the travel industry usually include just add-on products. Most often, the first purchase and post-purchase for the same user will happen in two different sessions, so the main question is how to combine data from both transactions.
My recommendation is to track both transactions as two normal/separate transactions (well, what else can you do since they happen in two different sessions?). However, you can still use the same transaction ID for both of them—of course, also pay attention to every product’s product type.
This way you’ll still be able to view both transactions in Google Analytics as a single one or two separate ones, depending on the dimensions that we put into the report. If you will be using some kind of date/hour/minute dimension, you’ll get two rows with the same transaction ID (first and post-purchase transaction separately) and different date/hour/minute values (because they happened at different times) and metrics’ values that apply to each of them.
If you won’t be using dimensions that have different values for every transaction pair, you’ll get one row with combined metrics that apply to both transactions (sums of revenue, tax, shipping, quantity, etc.).
Both approaches are OK, but it just depends on what you want to analyze.
The payment page is the last and the most important step of your booking funnel. You don’t want to lose your customers when they are standing there with their wallets open. Conversion optimization done right on the payment page can have a huge impact.
The payment page is usually the final checkout step. Nothing too special about it, but you can still get plenty of insights if you do it right. The most obvious thing is to use additional custom dimension to store payment type info and combine this data with transaction data. This enables you to do two things:
Another thing about the payment page is that it very often contains some sort of a payment form. It’s quite complex to track form usage with Google Analytics, so I suggest using other, more specific tools to do that (i.e., Hotjar, Mouseflow). This way you can get additional info about issues that users are having when they reach this step and act accordingly.
Let me point out a last but very important issue to pay attention to. Since lots of different payment options lead to external payment processing centers, it’s highly recommended that you use the following setup in your analytics; otherwise, your data in Google Analytics will not be correct:
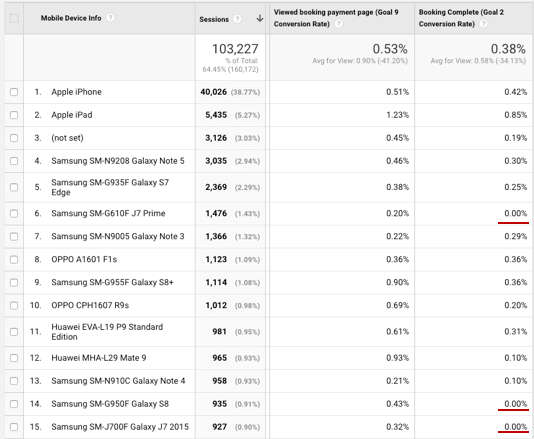
In addition to the above settings, you can use the funnel by goals reports I showed you at the beginning to identify issues on the payment page. Just by analyzing the drop-off at the payment page with different dimensions, you’ll be able to identify a lot of issues.
Below you can see an example of one such report where payment issues on certain Samsung mobile devices were identified:
A confirmation page is often a forgotten page in your travel booking funnel. If you do upsell and cross-selling on this page, you need to track it to understand performance. For example, if you cross-sell 3rd-party activities to your travelers, you can set up events to track how many times they were displayed and clicked on.
However, what I would like to point out here is that you can use the confirmation page to get other valuable insights. You really should use it to survey your customers and collect valuable insights. To learn why and how to do it, check out this blog post.
Once you have these insights, you can connect them with your analytics data in order to understand your customers better.
Yep, you guessed it 😉 We’ll dive into how to really understand your customers in our next piece.
Remember “Measure (analytics)” is just the first step in conversion optimization of your travel booking funnel. To learn more about the other steps:

hamid eslami
hi. thanks. that was a great article. can you explain in detail two approaches to get events data (product as a category) or (action as a category).
Iztok Franko
Hi, this is a matter of Google Analytics (or other web analytics) tool setup. Basically when we setup the digital analytics we do two things:
1. Business setup (why and what to track and what we’ll do based on that)
2. Tech setup (how to track – this is where we prepare technical guidelines of how to do the tracking)
Nils Medina
Hi, thanks a lot for this awesome article!
I have an issue setting up my booking funnel goals. Goals are limited to 5 per set, and my funnel requires 6 goals (search > offer page > checkout step 1 (details) > checkout step 2 (extras) > checkout step 3 (payment) > Booking confirmation).
What would you recommend here?
Iztok Franko
Hi Niels! Would need to undrstand better, but what I’ve seen people do is group goals in Goal set 1,2,3…And you do Goals 1-5 in first set, then Goals 6+ in set 2. You can still do custom reports, with different goals.
Nils Medina
got it, thanks for the fast reply!