

I’ve been doing airline ecommerce consulting and benchmarks for a long time, and I’ve rarely seen a proper airline digital analytics implementation.
If you want to do smart airline digital marketing, knowing how your business (e.g., website) is performing should be kind of a no-brainer, right? Proper measurement should be at the core of managing any business, especially a digital one.
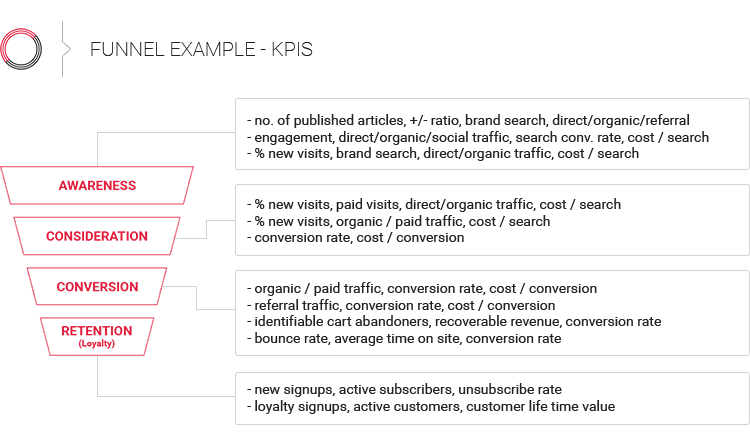
By proper, I mean you need a systematic way of measuring your airline booking funnel. This should be a logical first step. Once you’ve done that, you need a systematic way to track what’s happening with your customer from the moment they click on your online ad, throughout the purchase process on your website (or mobile app), and even after they’ve completed their booking. So, it’s about understanding your end-to-end customer journey. And if you can understand how it’s happening on different devices and map different channels (web, mobile, app), then you’re almost there.
So, why are we still struggling with this? Even more importantly, if you wanted to do your airline digital analytics from scratch, how would you do it?
When I saw this post by Liliana García Magaña, who managed the implementation of airline digital analytics at Mexican low-cost airline VivaAerobus, I knew she’d be the right person to provide answers.
Listen to the new episode of the Diggintravel Podcast about how VivaAerobus is building their new airline digital analytics via the audio player below, or read on for key highlights from our talk with Liliana:
And don’t forget to subscribe to the Diggintravel Podcast in your preferred podcast app to stay on top of airline digital analytics, innovation, and other trends!
Like many airlines, VivaAerobus is on its digital transformation journey. And like other airlines, they see a new, modern website as one of the key parts of that transformation. But what intrigued me most about this process was that Liliana and the team used website redesign as an opportunity to create a new digital analytics foundation.
Before COVID times, already the digital transformation process had started, and one of the main building blocks for the digital transformation was to renew the website, to switch from a very transactional website to a website that could engage our users, that could really display that we are evolving into a digital business as well. A year and a half ago, the full redesign of the website started, and with this opportunity we decided it was good to also build up our analytical foundation from scratch.
We decided to rebuild the full data layer to redesign all the different events we wanted to track, and to also pair it up with the development of the data lake at the same time. So at the same time we were migrating into a cloud data lake, which was also part of the digitalization efforts of the company. We decided to go very specific on the web analytics model so that from now on, we can track every interaction from our consumers and track the end-to-end behavior from the first time they browse on the website or the first time they receive an email all the way until the purchase and the flight.
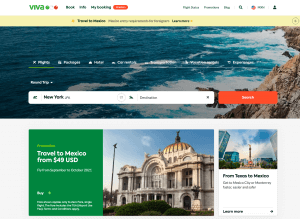
New beta version of the VivaAerobus website
Liliana touched upon a lot of interesting technical stuff (like the data lake part) there. But before digging into that, I wanted to know more about their plan – their analytics framework. When Liliana and the team started this, did they optimize (track in more detail) their existing framework? Or did they come up with a new digital analytics framework?
No, we redesigned even the framework. Before, we had an event definition like “discovery.” It was not very specific for the flows of the user. It had been built as it went. So we decided to rebuild this framework, and then we focused on organizing and building up the data in a way that we could easily understand the user behavior. We went from having maybe like 10 events to having 35 different event categories. All of them are now within a specific business purpose, so we would be looking for a flight search, and we have a shopping experience, which is the moment if you buy or not or you shop a flight or not. And then the booking flow. So we have all of these different flows. It sounds very simple, but we did not have that transparency in the data before. We designed it from scratch.
If you think about the business, the question that we wanted to solve with this new data layer and with this new architecture – do we want conversion rate per route or flow? Do we want to deliver data from the search engine? What type of questions do we want to be taken and improved upon this data? That was the framework. Let’s understand the foundation of each part of the purchase of the customer pre- and post-flight. Then the technical part came, but that was already leading that initial redesign of how we want to measure it.
Implementation of the new website and the new digital analytics framework impacted different teams across the VivaAerobus organization. Liliana and the digital analytics team worked with different stakeholders to define what they needed to measure.
It not only had an impact directly on the business in terms of our revenue, but also the type of data we can create for all of the different areas around us, based on the different needs of different areas. Say maybe operations wants to know how many online check-ins we have. Revenue management wants to know which routes are the most abandoned and why. Marketing wants to know what’s being clicked on the homepage, what promotions are having a higher CTR.
Based on all of this, we identified the main building blocks of each part of the business, so what type of data can revenue leverage. Do we have ancillaries? How do we create this? How do we build something strong for ancillaries so they can know which type are being clicked on, which ones could change their mind? These types of things. Payments, what types of payments are having errors? That’s between product and finance. How do we measure the errors? At the first stage of the beta phase and also hard launch, you want to know there are no errors or messages. So how do we track the errors and messages so the product can quickly react when we have those?
Post-purchase, how do we know which type of routes are having the intention of adding an ancillary before the flight, but they did not? When it comes to the transaction, we know that already, but all of these were touchpoints before, and we have to push a little bit the user. So we took all of that into consideration for the redesign of the analytical framework of the website.
I was impressed by the level of detail Liliana and the digital analytics team put into their framework. They went from 10 to 35 different event categories, which meant many more metrics to look at. But how did this impact the end-users? Sometimes people can be overwhelmed by many new metrics, almost like analysis paralysis. So, I asked Liliana: was education a big part of this project?
Definitely. If we are in the ecommerce environment, for us, it’s clear what we are doing and how it’s evolving. But for all the users, it’s not. Even for several members of the ecommerce team, it was still not clear what we were doing. What we did first was a digital data literacy program for preparing for the launch of the website. First we organized several sessions for the ecommerce and commercial teams on how to use Google Analytics and how to interpret the data, to be familiar with the concepts that they have. We told them, “You’re seeing these current properties. When you’re using the website, it’s going to change a little bit, but please make sure you’re familiar with the data.” It was around 16 hours of training. We scheduled within one month and a half, 4 hours per week, so we could keep the base. That was the first building block.
I really liked how systematic Liliana and the team were in creating and implementing the digital analytics training because you rarely see it done this way. The next step for the team was to provide business users with a set of dashboards that would provide them actionable insights.
We started building a set of dashboards in a very simple way for the users. Based on the search data, how can revenue say, “Which routes are being searched the most? Which dates are being searched the most?” So we built all of these different dashboards. We used Tableau or Google Data Studio sometimes. We used a mix of these tools to have it ready for the launch and then to start sharing it with stakeholders.
Now we are very close to the launch. We prepared a series of small trainings with the revenue and marketing teams and the digital team to explain in a very user-friendly way what the difference is. We go from measuring these 15 events to measuring all 35. This can be overwhelming, yes, but interpretability is easier now. What changes and what doesn’t change? Sessions, conversion, it does not change. That’s an overall metric. Then we explained the purchase funnel. When the user lands on the website, what are we measuring in that moment? So we prepared the user flow and each different stage of the funnel, we identified this for you. You can use these event categories, these event actions, for the main things they can use.
The last part of the education (you could even say change management) was to document all these new metrics and dashboards.
We created a full dictionary of events so they could know what triggers what, because that’s the hardest part when it comes to these analytics. Maybe some business users understand where the checkout starts but not really when it’s triggered, and that can lead to misinterpretation of the data. So we created these resources for them to leverage, and that’s going so well. It’s also helping us evolve the data-driven approach for marketing or revenue that they know this is all the data that now we can leverage as a company.
When I read Liliana’s LinkedIn post, I noticed she mentioned gaining tons of learnings from the implementation process. So, what was the biggest learning from this journey for Liliana and the airline digital analytics team?
I think from a management side, the biggest learning was definitely that when you are building a web analytics framework, it has different building blocks. It has different stakeholders involved. When you talk with the developer, you have to understand what his focus is. Maybe he just focuses on “Tell me exactly what is the moment when I have to trigger this event.” When you come to product, product is more focused on the performance of the website itself. Marketing sees things on their own side. And for us, we have to see that whatever we’re building is scalable for any new flow in the future related to the website.
So I think it’s learning how to address the specific message to all the different parties involved in the web tracking. Fortunately, we had an agency who was helping us implement the tags in the GTM. All of this flow at the beginning was difficult to trigger. Specifically with the development team, you have people trigger these events specifically with this action. We thought they would understand what we wanted as a business, but it was not the case. I think that’s the most learning part.
Liliana shared tons of other great airline digital analytics insights in our podcast talk. Check out the full podcast interview if you’re interested in:
If you want to learn from leaders like Liliana about airline digital analytics or want to be the first to know when our next Airline Digital Talk will be published, please:

No Comments