Select Sidearea
Populate the sidearea with useful widgets. It’s simple to add images, categories, latest post, social media icon links, tag clouds, and more.


hello@youremail.com
+1234567890
+1234567890
Populate the sidearea with useful widgets. It’s simple to add images, categories, latest post, social media icon links, tag clouds, and more.


Iztok Franko

“Data is the new oil” was probably one of the most popular airline clichés before COVID-19 hit. A data-driven airline definitely sounds smart, but can a data-driven approach help with airline recovery?
Boston Consulting Group (BCG), one of the world’s most renowned consultancy companies, definitely thinks so. They are stressing a data-driven approach as one of the key elements of recovery in their “Post-COVID-19 Flight Plan for Airlines”:
[Airlines] that take a data-driven, action-oriented, and digitally supported approach will have the best chance to emerge stronger from the COVID-19 crisis.
Data will most probably not replace oil to make your planes fly any time in the near future, but better, data-driven decision making is something that should be really important for airlines. You can find interesting figures about the impact of advanced analytics for airlines in this Kambr media article:
McKinsey estimates that airlines could reap a 5-10 percent improvement in total revenue by leveraging advanced technology and analytics. Meanwhile, Oliver Wyman estimates new connectivity and advanced analytics can save airlines between 2% and 2.5% on total global operating costs, equating to $5-6 billion annually.
But how can you implement advanced analytics in practice to achieve this 5-10 % improvement in revenue?
Is collecting vast amounts of data and having great analytic tools enough? Based on my experience, the answer would be no. It always comes down to the people who use these tools and data. And this is where data-driven airline culture comes into play.
Now, I assume you’ve heard a lot of “data-driven culture” clichés as well. I certainly have, so I wanted to talk with someone who is trying to create this culture in a real airline environment. Furthermore, I wanted to give you an example of an action plan for how to do that in practice.
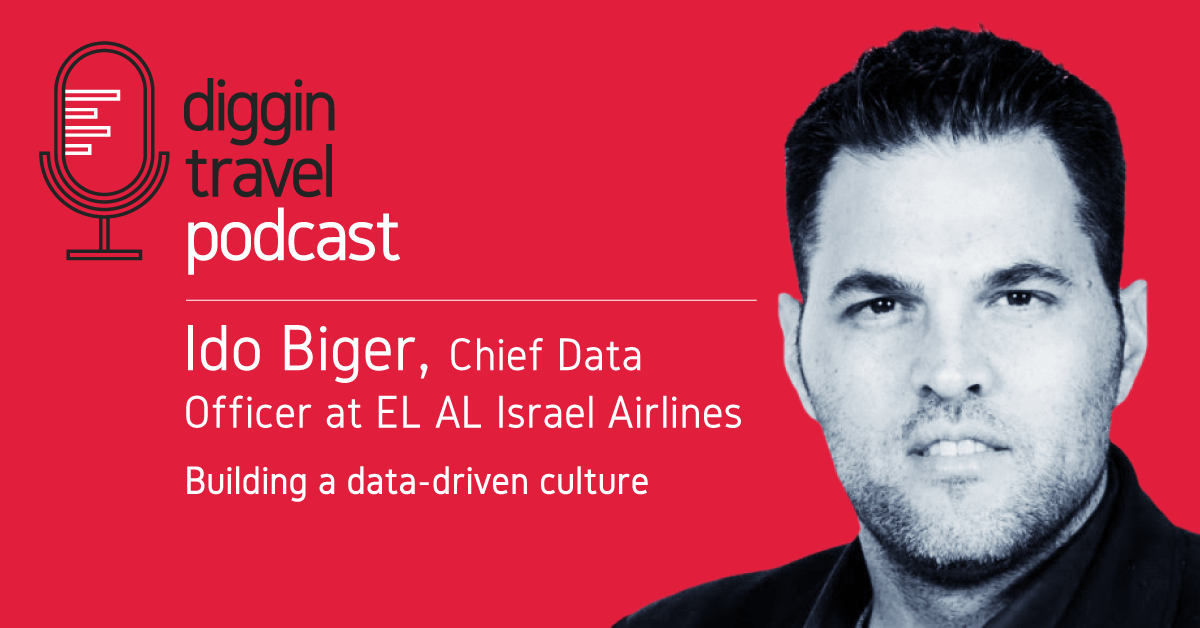
This is why I talked to Ido Biger, Chief Data Officer at EL AL Israel Airlines.
Listen to the new episode of the Diggintravel Podcast about how to build a data-driven airline culture via the audio player below, or read on and see the 5-step action plan.
And don’t forget to subscribe to the Diggintravel Podcast in your preferred podcast app to stay on top of airline digital, innovation, and analytics trends!
Before we jumped into the HOW of creating a data-driven airline culture, my colleague and Diggintravel Academy Analytics Instructor, Boštjan, wanted to ask Ido one thing.
Why is this so difficult for airlines? Is being data-driven and doing advanced analytics really more difficult for airlines than for other industries? Here is Ido’s take:
Wow, that’s a great question because I’ve had the privilege of being in many, many industries, such as the financial industry, telecommunications, ecommerce. I was working a lot in enterprises and dealt with data. I think the main issue that might cause the answers that you got from other airlines is that we’re dealing with a quantity, an amount of systems that we’ve never seen before.
For example, in telco, I used to work with 60-70 different systems. Now it’s over 100. All the different pillars that I’m confronting on a daily basis now are something I’m not used to, or I wasn’t used to in other industries because in an airline, it’s like joining seven different companies. When I first joined EL AL, it totally felt like this. Taking data from seven different companies and joining it together.
I think this is the main difference. The cultural difference, different pillars that act as their own companies. But technology-wise, it’s the same thing. I love it. In all different kinds, in all different enterprises, the challenges are the same besides the cultural thing.
Ido mentioned one other challenge he faced when he tried to establish a new data-driven airline ecosystem. Not only are there different departments that use different systems and data, but they also interpret the same data differently:
When I got [in the airline] I understood that first of all, creating this one truth is very, very hard because there isn’t one truth. Each and every one of the pillars that I mentioned before had their own language. Not just their own data, but their own language, and sometimes even the same term was used in several pillars, but in a different way. For example, in the airlines, load factor. You have a load factor, but the commercial people look at it as load factor of people who pay money. They don’t care about the crew, they don’t care about the pilots. But the service, of course they care about it because they have to serve those people. They have to bring food for them, etc.
So just this simple term, ‘load factor,’ can be three or four different types of load factor that just needed to be better – so there’s not one truth. There are four different terms. The service load factor and the commerce load factor, for example. In this case, I had to first of all understand the differences and the conflicts and what were the main issues around everything even before I dealt with the data itself.
Once Ido and his data team understood the challenges, they could start with a plan to create a data-driven airline environment. Here you can see the 5 steps Ido identified in our podcast chat.
Many airline data projects fail because they start with too big of a scope and it takes too long to show the value of advanced analytics. So, this is what Ido did to kick-start their data and analytics initiatives:
It’s very important to choose your first battles, let’s call it – even though it wasn’t a battle, of course; it was a challenge. But it’s very important to choose the places where you can feel that you have a very strong, for example, sponsor. In my case, it was the VP of Operations. The data world was simple enough for us to come up with a quick win. Even though we were building a data product on top of 14 different systems, and of course, none of them was extracted to the data warehouse before, I knew exactly where I wanted to be. That was the area of on-time performance, for example.
So we started this one place of working with the VP of Operations, where we started to collect all the relevant information for him to have his on-time performance weekly forum and collected all the relevant data for him to move from the PowerPoint to, in this case, Tableau – for him to see all the information that he needs in order for this discussion to be on the data and not what is the data. Sometimes the different units were fighting over what’s the right data and who’s the one to blame.
Once you have all the numbers and all the figures and all the relevant trends, etc., on the screen in front of you, automatically generated, the conversation immediately shifted to, ‘Okay, what are we going to do with that?’ and not ‘What are we looking for?’ or ‘What is the right number?’
So immediately once he had this on his mobile and he had it on his screen in his weekly forum, he was showing off, in a good way, to his colleagues and peers in the management. From that point on, everybody wanted to have their own quick win – create my own weekly forum or my own data product so that I can immediately know my situation and make my decisions based on that.
The next mistake you should avoid is prioritizing the standardization of data over insights. The goal should be insights first, and then starting to standardize. Otherwise, if we try to standardize first, we end up waiting too long. Did Ido and the team use the same approach?
Yeah, we created this methodology called Rapid BI (business intelligence). By that, we eliminated the need for a well-structured model to be created on the data warehouse in order for us to have a good BI implementation, for example.
This allowed us to work on several products simultaneously where we’ve got the operational system in this mirroring lake and creating this semantic layer which of course utilized the same dimensions in some way in several objects and maintains one language even though behind the scenes it was kind of quick and dirty.
But the customer doesn’t care, really, if it’s quick and dirty. He just cares if he has his [analytics] product. So it was very easy for us to implement.
Listen to the full podcast with Ido to learn how Rapid BI was implemented in practice (how they defined the semantic layer, business entities, data warehouse, mirroring schema, etc).
Getting the first actionable reports fast should be one of your main goals. The second goal should be to implement a modern, agile BI platform. We’ve written about how an agile travel analytics platform should work in the past.
Ido and the team used Tableau to provide their users with an easy-to-use analytics platform, that stimulates the key elements of agile analytics: self-exploration and looking for actionable insights.
[It was very important] the data was reflected very fast, in a very good way, very convenient way. That’s why we chose Tableau to be used on the mobile, both phones and tablets. It was very important for our people to utilize it and to visualize it very simply, even though they thought those are the kind of things you can never connect.
Once we did it, it was like a fire in a haystack – very, very fast-moving, as a rumor moves fast. There’s the new data division that can do magic for you.
However, even a modern, agile BI and analytics platform will not make you data-driven. Every tool is only as good as the people that use it.
This is why this part was the crucial element of implementing a data-driven airline culture at EL AL.
I think the most important part, was the data literacy program. I had a very nice lady that was the Head of the Data Literacy Program, and she mapped all the data users of the organization, which was approximately 1,000. We leveled them to very simple users that are just getting their reports and that’s it, sometimes getting their reports and exporting to Excel and nothing more, doing all the analysis part in Excel. We had the medium level analysts that were drag-and-drop and working a bit better with the data products. And we had the very, very advanced ones. We called them Champions.
Now, not every business unit needs to have a Champion, but they have to have someone that will define what he needs. For example, you have to have one Champion, two Mediums, and five Basic Analysts. We created this program for them to learn how to become at the certain level that they need.
Let’s take SQL for example. If you have a simple query, you select where this is the basic platform. So we taught the basics of SQL to those people. If you had to have an intermediate level where you had to join a few tables and make some analytical functions on top of that, that was the medium level, and we had a second training for that and a few exams to make sure they’re aligned to this level. The more advanced part was, of course, procedures and PL/SQL developers that were created on top of the ones that they talked to before.
So it really became a program that everybody was part of. It’s not something that we taught and they did. It’s something that we had joint goals of this program, and we were adjusting the needs and adjusting the methodology as we go. It’s a never-ending story.
If someone thinks that implementing data culture is something that has a beginning and an end, he’s got it all wrong. It’s a journey that never ends – which is a good thing. You always learn and you always improve yourself along the way.
What Ido and the team did was they basically democratized data across the company, so it was no longer the sole privilege of the data science or data department. Instead, they empowered people – they called them champions – to do a lot of things with data by themselves, without the involvement of the data department. This meant that they could generate insights and leverage data much faster. But there was even more “power” that the EL AL data team placed in the hands of the “Champions”:
Not only that, they can train their own people. If we create this program where we train the trainers in this case and create let’s imagine 30 Champions across the organization, they can teach the Medium and Basic Analysts without my interference. Because I don’t want to be a bottleneck. I want to be someone who helps them or enables the business to do his job better. I will never understand operations as well as the operation guys. Of course, I can learn, I can do all that I can in order to do so, but they will always be better than me at what they do. In cargo are the same, in service the same, and of course in finance the same.
But I can teach people to utilize data in a better way. And of course, when you talked about self-service, those Champions have the privileges of creating and even connecting to new sources by themselves, because sometimes the finance people have their own Excels, have their own resources that they want to utilize. Of course, if one of them is a solid Champion, I can give him all the privileges needed to connect to his own source and work on that and create his own truth as far as the business side in the finance department.
When you’ve completed all four steps Ido talked about thus far, you are ready for the final, key mindset shift when using your data. I’m talking about how you can go from reactive (looking at the past) to proactive (identifying future trends) analytics.
In the current airline environment, which is heavily impacted by COVID-19, we don’t have the stability to look at past patterns to predict the future. For Ido and the team, the key part of addressing this challenge was to provide real-time insights that will allow EL AL to become more pro-active:
When I joined EL AL, in order to understand yesterday’s sales, or even know yesterday’s sales, you had to wait for tomorrow. So it was a 48-hour difference.
In our current world, there is no way there’s going to be any solid reason for a company to survive if they only know yesterday’s sales tomorrow.
So the main challenge here was technical, but it was something that allowed us to do it because we dreamt. I said, in telco, there is not even one model that is not working in real-time or near real-time. Let’s say for example if the source is available. There is no reason for us not to build the visualization layer in real time, all the data processes that are going to be involved with that.
The entire world is changing now, and you can’t work on the supervised learning models because past models won’t be relevant for now maybe, because everything has changed. But if you have all the reflection of the data in real time, you can really act in a better way than reacting in a 48-hour latency.
Everything we did was on the technical side, creating the right data platform for us to work and adjust ourselves to the business needs – in this case, focusing more and more and more towards real time. On the predictive level, there were some models that remained the same, but most models, specifically on the airlines of course, did change. I know that. So we have to rebuild history, as we like to say.
Data and analytics will be a key part of our new Airline Digital Retailing Academy. If you want to learn how to work with data and become better at digital analytics on your own, check out our [NEW] Diggintravel Digital Retailing Academy.
If you want us to look at your data and provide actionable insights, check out our Services.
I am passionate about digital marketing and ecommerce, with more than 10 years of experience as a CMO and CIO in travel and multinational companies. I work as a strategic digital marketing and ecommerce consultant for global online travel brands. Constant learning is my main motivation, and this is why I launched Diggintravel.com, a content platform for travel digital marketers to obtain and share knowledge. If you want to learn or work with me check our Academy (learning with me) and Services (working with me) pages in the main menu of our website.
Download PDF with insights from 55 airline surveyed airlines.
Thanks! You will receive email with the PDF link shortly. If you are a Gmail user please check Promotions tab if email is not delivered to your Primary.
Seems like something went wrong. Please, try again or contact us.


No Comments